Figures & data
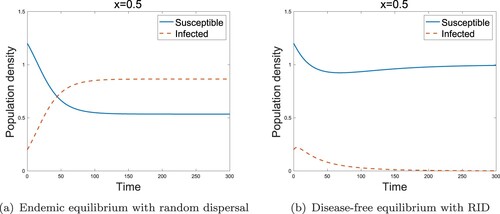
Figure 1. Endemic occurs when the infected individuals without RID are in the high-risk domain ().
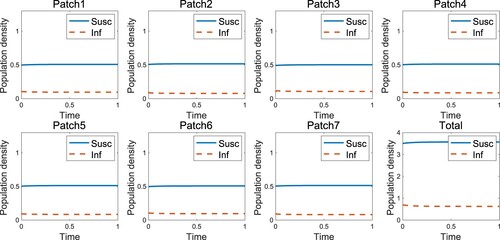
Figure 2. Disease-free occurs when the infected individuals move with RID in the high-risk domain ().
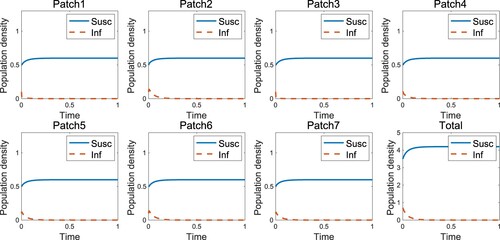
Figure 3. Endemic occurs when the infected individuals move with RID in the high-risk domain ().
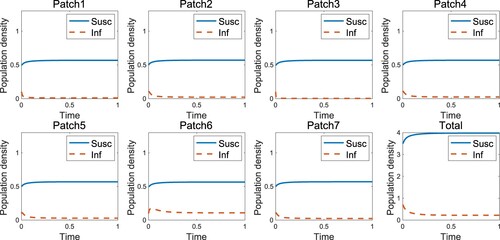
Figure 4. Effect of RID for two-patch models in the high-risk domain (a) Endemic equilibrium without RID (b) Disease-free equilibrium with RID ( and k = 6).
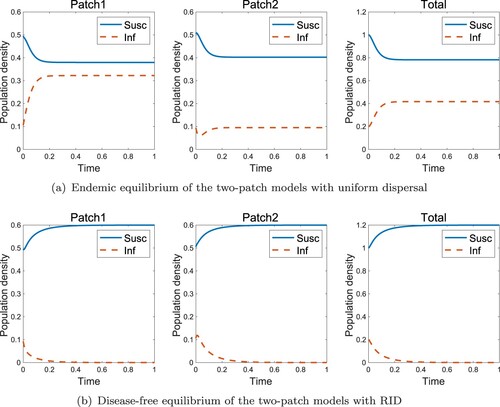
Figure 5. Effect of sensitivity k for two-patch models in the high-risk domain (a) Endemic equilibrium with low sensitivity (k = 3) (b) Disease-free equilibrium with high sensitivity (k = 6) (,
and
).
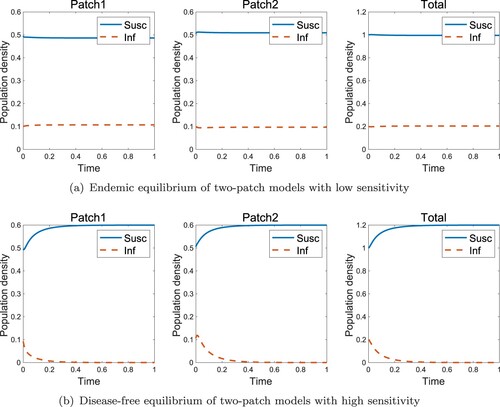
Figure 6. Effect of RID for reaction-diffusion models in the low-risk domain (a) Endemic equilibrium without RID (b) Disease-free equilibrium with RID. (,
,
and h = 0.15.)
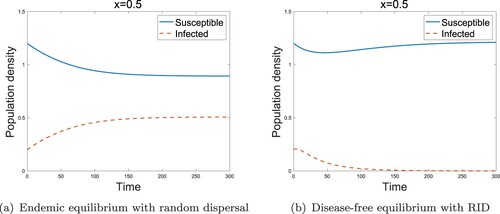
Figure 7. Effect of sensitivity for reaction-diffusion models in the high-risk domain (a) Endemic equilibrium without RID (b) Disease-free equilibrium with RID. (
,
,
and h = 0.2.)