
Figures & data
Table 1. The comparison of similar studies
Table 2. Interviewee profiles
Figure 1. Conceptual framework
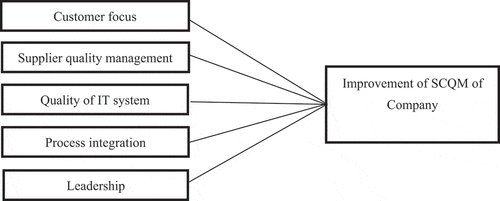
Table 3. Four steps to reduce the implementation gaps
Table 4. Study respondents’ demographic information
Table 5. Correlation analysis
Table 6. Summary of model fitting and regression analysis
Table 7. ANOVA analysis of the proposed model
Table 8. Coefficients
Table 9. Results of the Kaiser–Meyer–Olkin measure of sampling adequacy and Bartlett’s test of sphericity
Table 10. Commonalities of the Indicators