
Figures & data
Table 1. Synthesized overview of blockchain attributes (Firsova and Abrhám Citation2021).
Figure 1. Choosing the right BT for your business: a decision-making flowchart (Wüst and Gervais Citation2018).
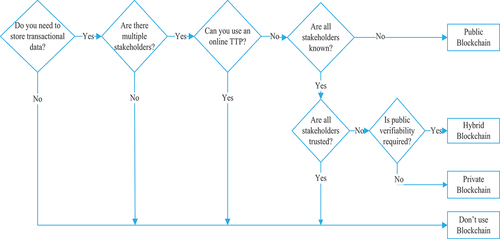
Table 2. Summary of the research on BTA in different contexts.
Figure 2. Stages of SLR (Kitchenham and Charters Citation2007).
Table 3. The list of 112 selected research papers for this SLR.
Table 4. Quality criteria table.
Figure 3. Methodological approach (Oguntegbe, Paola, and Vona Citation2022).
Table 5. Coding agenda for identifying factors affecting BTA in business organizations (adapted from Mayring Citation2014).
Table 6. Inter-rater reliability scores (kappa) for coded categories in the 112 reviewed papers.
Figure 4. Word cloud of extracted enabling and inhibiting factors of BTA.
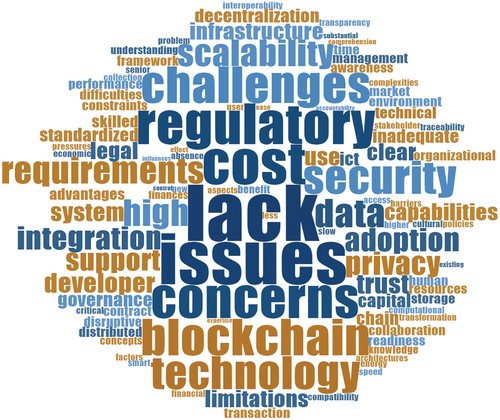
Table 7. Summary of literature review on critical factors influencing BTA in business organizations.
Table 8. Integrated themes and underlying codes of the factors affecting BTA in organizations.
Table 9. Comprehensive thematic analysis of blockchain business values.
Figure 5. The conceptual framework of BTA in organizations.
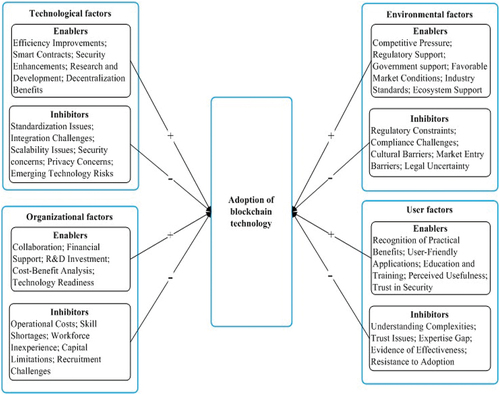
Figure A1. Types of publications.
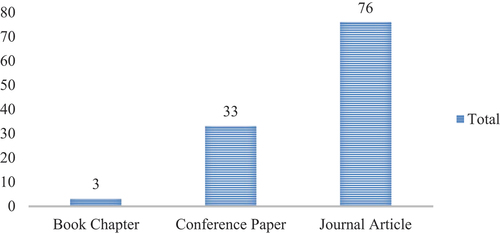
Figure A2. Types of research methods used.
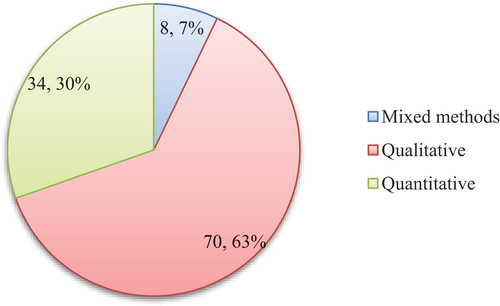
Figure A3. Co-authorship network of countries.
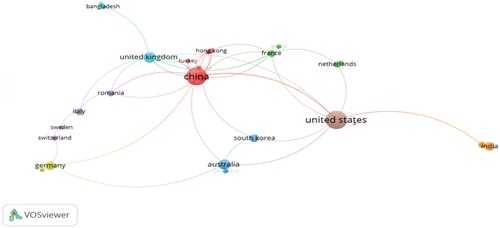
Figure A4. Network map of co-occurrence of keywords.
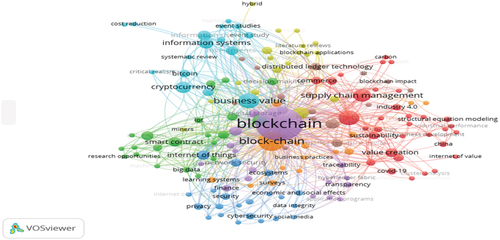
Figure A5. Term co-occurrence map.
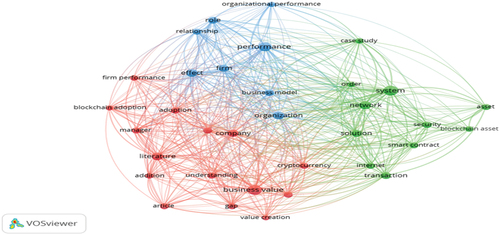
Table A1. PCA of the extracted terms from keywords and abstracts.
Figure A6. 12 factors generated from 36 extracted terms (eigenvalue> 1).
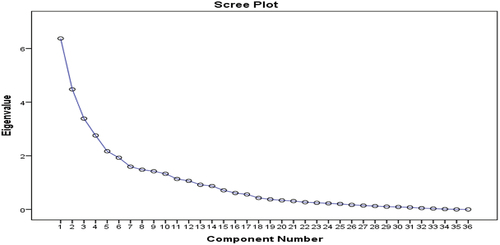
Figure A7. Hierarchical clustering of BT concepts and their business value implications – Dendrogram.
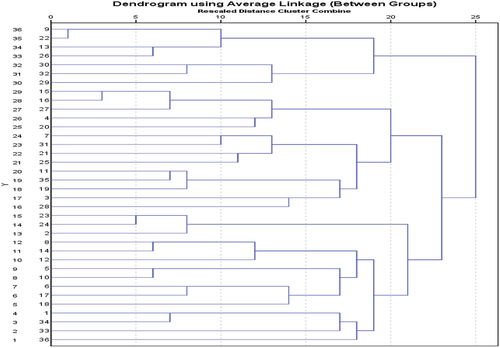
Table A2. Quality assessment scores of the 112 selected research papers.
Data availability statement
The data generated and analysed during this study are available online at https://osf.io/ygwu8.