Figures & data
Figure 1. Effect of A. sativum concentration in the polarization curves for carbon steel in 0.5 M H2SO4 under stagnant conditions.
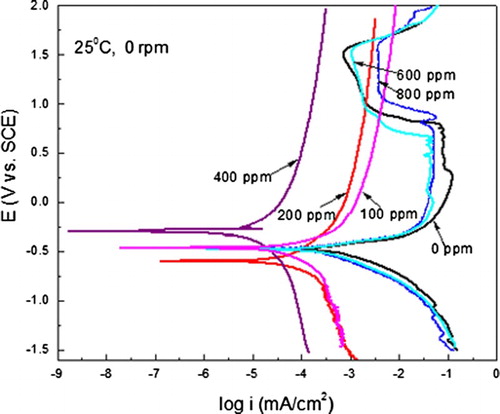
Figure 2. Effect of A. sativum concentration in the Nyquist diagrams for carbon steel in 0.5 M H2SO4 under stagnant conditions.
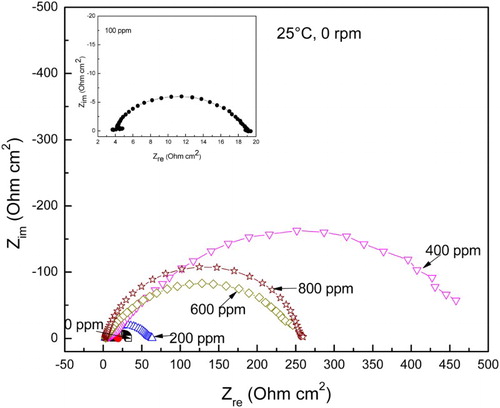
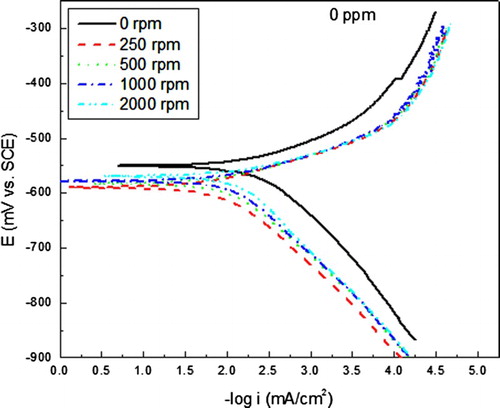
Figure 3. Effect of rotating speed in the polarization curves for carbon steel in uninhibited 0.5 M H2SO4 solution.
Figue. 4. Effect of rotating speed in the polarization curves for carbon steel in 0.5 M H2SO4 + 400 ppm of A. sativum.
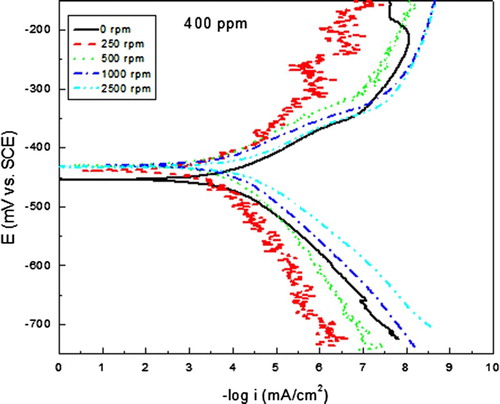
Figure 5. Effect of rotating speed in the Nyquist diagrams for carbon steel in uninhibited 0.5 M H2SO4 solution.
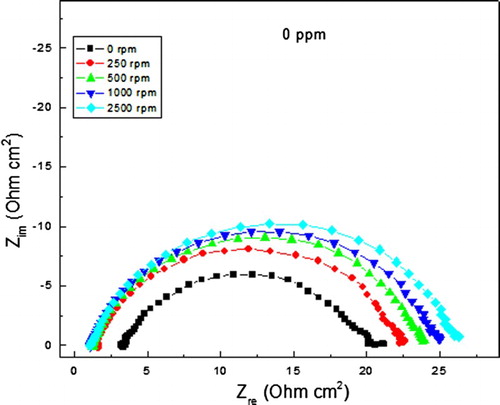
Figure 6. Effect of rotating speed in the Nyquist diagrams for carbon steel in 0.5 M H2SO4 + 400 ppm of A. sativum.
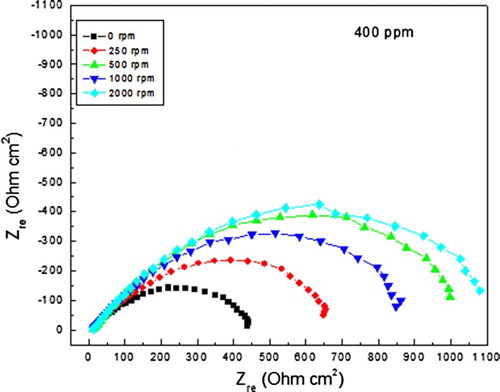
Figure 7. Variation of the Rct value with time for uninhibited and inhibited solutions at different rotating speed values.
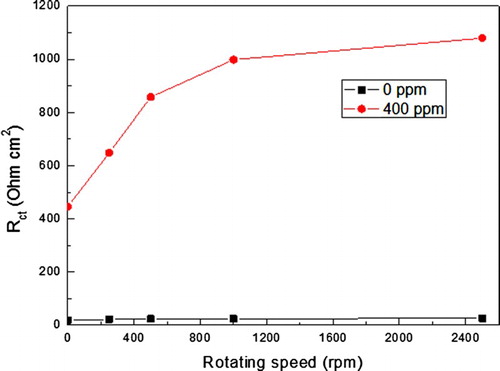
Figure 8. Nyquist diagrams for carbon steel at different exposure times in 0.5 M H2SO4+ 400 ppm of A. sativum at 250 rpm.
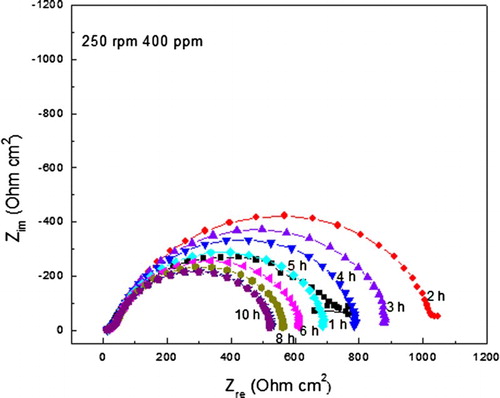
Figure 9. Variation of the Rct value with time for carbon steel in 0.5 M H2SO4+ 400 ppm of A. sativum and different rotating speed values.
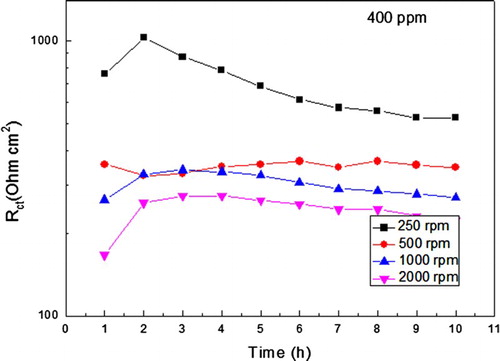
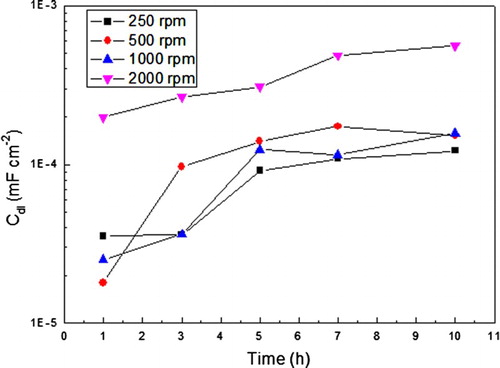
Figure 10. Variation of the Cdl value with time for carbon steel in 0.5 M H2SO4+ 400 ppm of A. sativum and different rotating speed values.