Figures & data
Figure 1. Effect of M. sativa concentration and temperature on the weight loss tests for 1018 carbon steel in 0.5 M H2SO4.
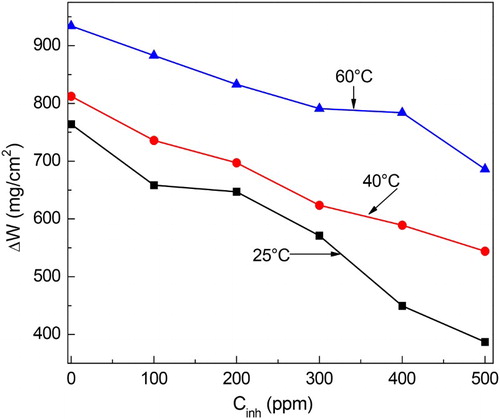
Figure 2. Effect of M. sativa concentration and temperature on the inhibitor efficiency value for 1018 carbon steel in 0.5 M H2SO4.
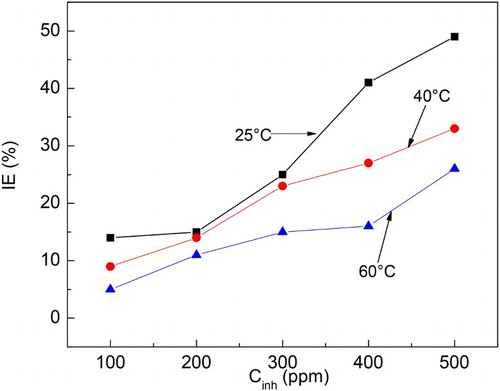
Figure 3. Frumkin type of adsorption isotherm for 1018 carbon steel in 0.5 M H2SO4 with additions of M. sativa.
Table 1. Electrochemical parameters for polarization curves at 25°C.
Figure 4. Effect of M. sativa concentration on the polarization curves for 1018 carbon steel in 0.5 M H2SO4 at 25°C.
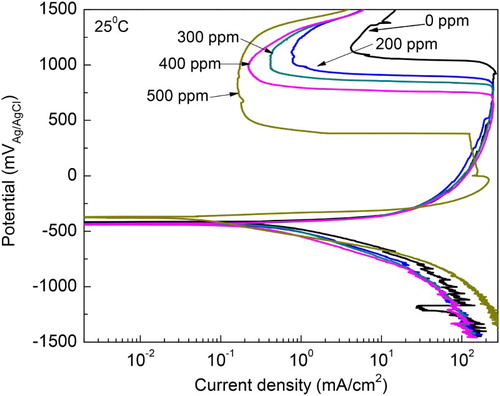
Figure 5. Effect of M. sativa concentration on the polarization curves for 1018 carbon steel in 0.5 M H2SO4 at 40°C.
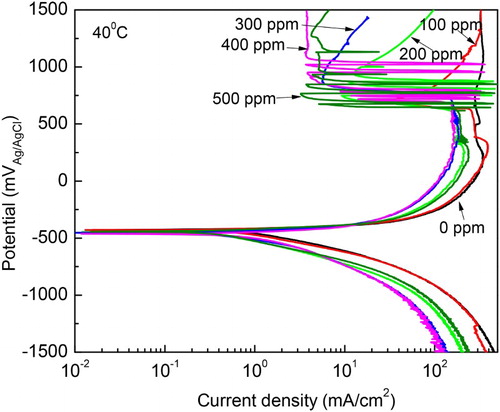
Figure 6. Effect of M. sativa concentration on the polarization curves for 1018 carbon steel in 0.5 M H2SO4 at 60°C.
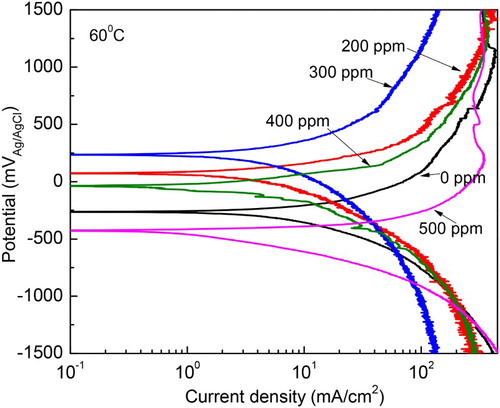
Figure 7. Effect of M. sativa concentration on the (a) Nyquist and (b) Bode plots for 1018 carbon steel in 0.5 M H2SO4 at 25°C.
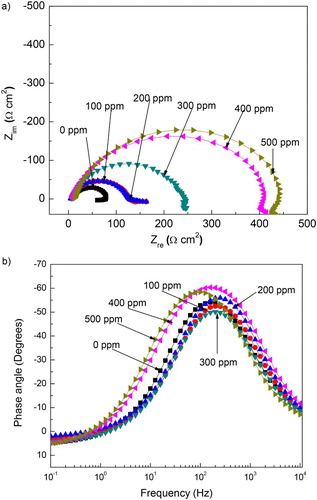
Figure 8. Equivalent circuit used to fit EIS obtained data for 1018 steel in 0.5 M H2SO4.
Figure 9. Variation of the Nyquist curves with time for 1018 carbon steel in 0.5 M H2SO4 at 25°C with the addition of 500 ppm of M. sativa.
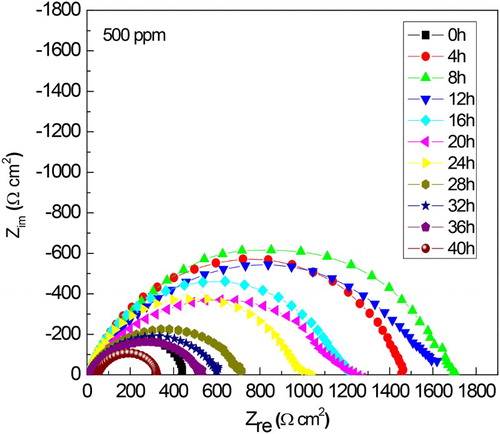
Figure 10. Variation of the Rp and Cdl values with time for 1018 carbon steel in 0.5 M H2SO4 at 25°C with the addition of 500 ppm of M. sativa.
Figure 11. Effect of M. sativa concentration on the Nyquist plots for 1018 carbon steel in 0.5 M H2SO4 at 40°C.
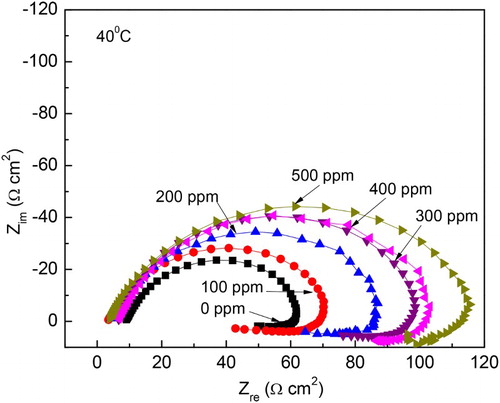
Figure 12. Variation of the Rp values with time for 1018 carbon steel in 0.5 M H2SO4 at 25°C with the addition of 0 and 500 ppm of M. sativa.
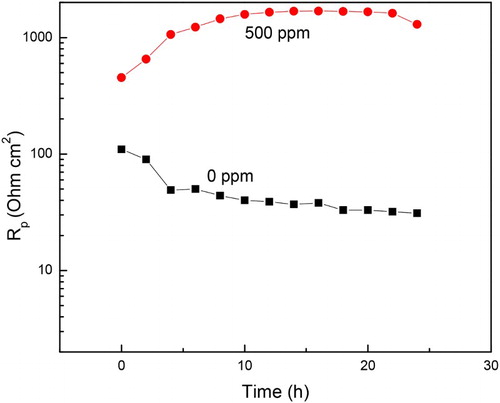
Figure 13. Variation of the inhibitor efficiency value with time for 1018 carbon steel in 0.5 M H2SO4 at 25°C with 500 ppm of M. sativa.
Figure 14. Effect of M. sativa concentration on the Nyquist plots for 1018 carbon steel in 0.5 M H2SO4 at 60°C.
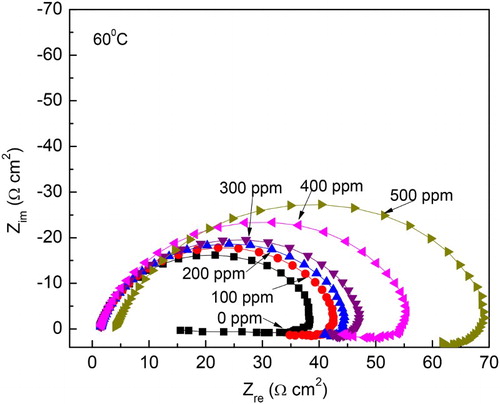
Figure 15. SEM micrographs of corroded 1018 steel specimens in uninhibited 0.5 M H2SO4 (a, c, e); and with addition of 500 ppm of M. sativa extract (b, d, f) at 25°C (a, b), 40°C (c, d) and 60°C (e, f).
Figure 16. EDX analysis of corroded 1018 steel specimens in 0.5 M H2SO4 containing (a) 0 and (b) 500 ppm of M. sativa extract at 25°C.
Figure 17. Infrared spectroscopy of M. sativa (pure extract or total extract), before (to) and after the corrosion test (tf).
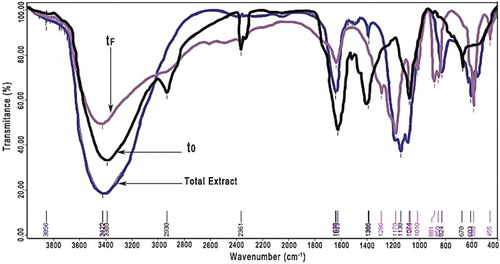
Figure 18. Chemical structure of the main compounds reported in M. sativa.