Figures & data
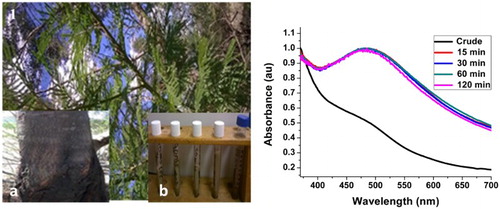
Figure 1. (A) Acacia mearnsii whole plant Inset: (a) stem bark (b) Color of the A. mearnsii extract (blue capped) and color of the solution after the formation of AgNPs (white capped) (B) Absorption spectra of AM-Ag-NPs synthesized using 0.1 mol/L AgNO3 at 60°C at different reaction times.
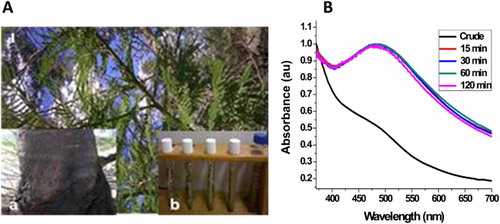
Table 1. Experimental method.
Figure 2. (A) Absorption spectra of AM-AgNPs synthesized using 0.1 mol/L AgNO3 at 40°C and (B) room temperature at different reaction time.
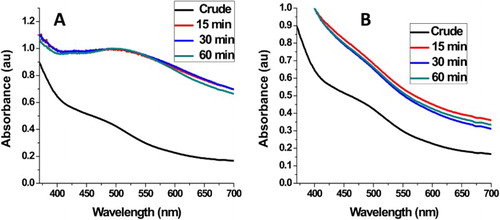
Figure 3. FTIR of crude sample and synthesized AM-AgNPs at 60°C.
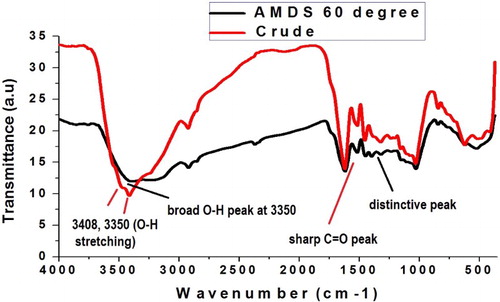
Table 2. FTIR analysis of the crude extract and the as-synthesized AM-AgNPs.
Figure 4. SEM micrographs of crude Acacia mearnsii (A) and as-synthesized AM-Ag-NPs (B) at 60°C.
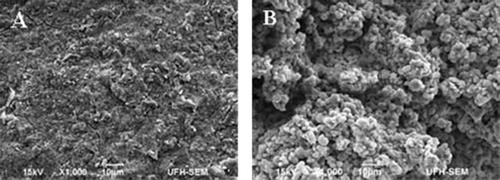
Figure 5. EDS spectra of AMDS pure sample (A) and as-synthesized AM-AgNPs (B) at 60°C.
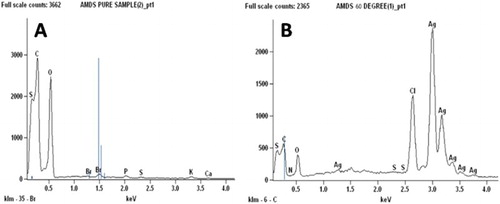
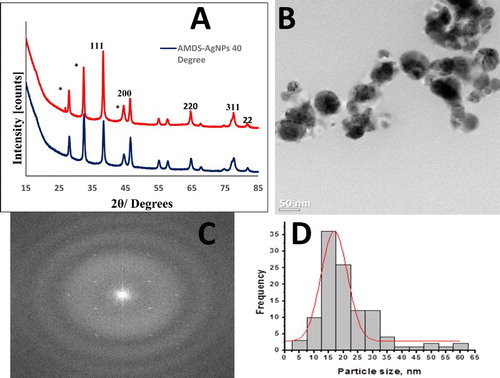
Figure 6. (A) A typical XRD pattern of AM-Ag-NPs synthesized at 60°C and 40°C. HRTEM image of AM-AgNPs (B) with corresponding FFT (C) and size distribution (D).