Figures & data
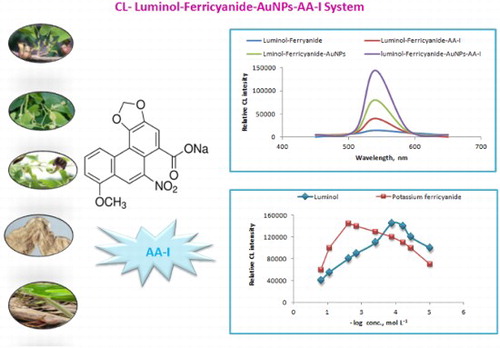
Figure 1. Chemical structure of aristolochic-I sodium salt.
Figure 2. (a) TEM image of AuNPs and (b) UV-absorption spectrum of AuNPs.
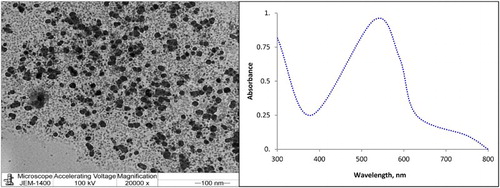
Figure 3. Selection of suitable oxidizing agents for CL reaction.
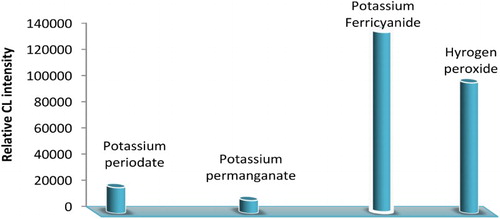
Figure 4. Effect of luminol and potassium ferricyanide concentration on CL intensity, for luminol concentration (1.5 mL of AuNPs solution and potassium ferricyanide 1.0 × 10⁻² mol L−1) and for potassium ferricyanide concentration (1.5 mL of prepared AuNPs and luminol 2.0 × 10⁻⁴ mol L−1) with AA-I 25 g mL−1.
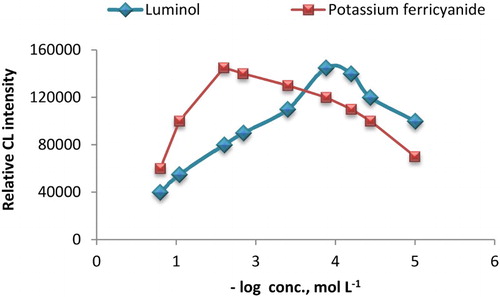
Figure 5. Effect of added volume of AuNPs on SIA-CL luminol-potassium ferricyanide system.
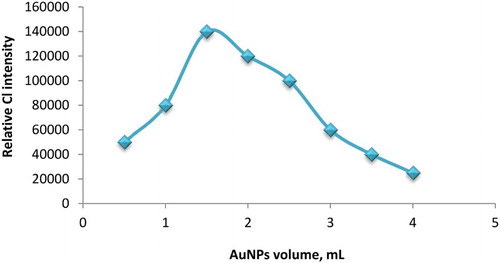
Figure 6. Effect of sodium hydroxide, ammonium hydroxide, sodium carbonate and sodium bicarbonate concentration on CL intensity of luminol-potassium ferricyanide system (1.5 mL of AuNPs, potassium ferricyanide 1.0 × 10⁻² mol L−1 and luminol 2.0 × 10⁻⁴ mol L−1).
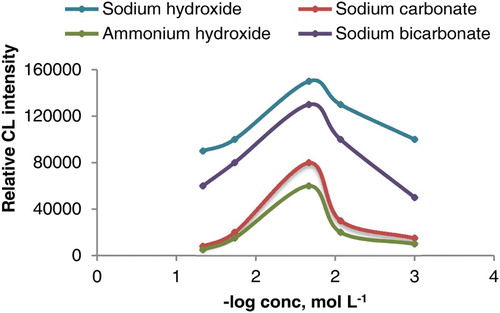
Figure 7. The influence of flow rate on the relative CL intensity. Conditions; 50 µL of 2.0 × 10⁻⁴ mol L−1 luminol; 30 µL of AuNPs and 30 µL of 1.0 × 10⁻² mol L−1 potassium ferricyanide.
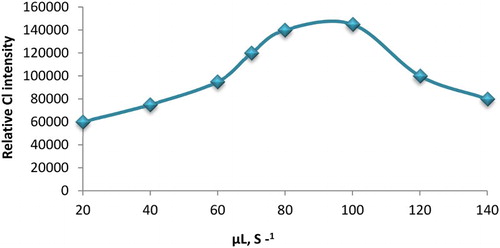
Table 1. The control program of AuNPs-luminol-potassium ferricyanide SIA-CL detection of AA-I.
Table 2. Performance data obtained from the determination of AA-I using AuNPs-luminol-potassium ferricyanide system.
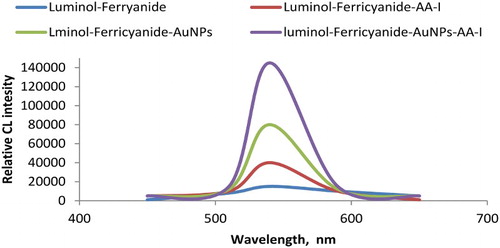
Figure 8. Comparative CL signals using luminol-ferricyanide, luminol-ferricyanide-AA-I, luminol-ferricyanide-AuNPs and luminol-ferricyanide-AuNPs-AA-I: Optimum conditions: 50 µL of 2.0 × 10⁻⁴ mol L−1 luminol; 30 µL of AuNPs and 30 µL of 1.0 × 10⁻² mol L−1 potassium ferricyanide and 50 µL sample AA-I.
Scheme 1. The mechanism of CL reaction of luminol-ferricyanide in the presence of AuNPs.