
Figures & data
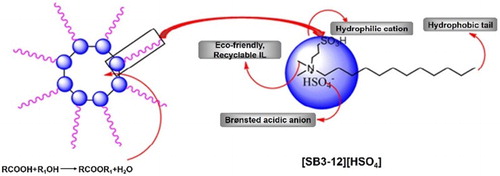
Figure 1. Illustration of auto-isolation of water generated during esterification.

Figure 2. TGA curves for [SB3-12][HSO4].
![Figure 2. TGA curves for [SB3-12][HSO4].](/cms/asset/5694aecf-b7b7-4755-ae49-d227bf5f6f69/tgcl_a_1342001_f0002_b.gif)
Figure 3. Factors on oleic acid conversion (based on the mass of oleic acid): (a) catalyst loading, reaction conditions: n (ethanol): n (oleic acid) = 1.5:1, 78°C, 3 h; (b) reaction time, reaction condition: n (ethanol): n (oleic acid) = 1.5:1, 5 wt% catalyst (based on mass of oleic acid), 78°C; (c) amount of ethanol, reaction condition: 5 wt% catalyst (based on mass of oleic acid), 3 h, 78°C; (d) water content on the catalytic activity, reaction condition: n (ethanol): n (oleic acid) = 1.5:1, 5 wt% catalyst (based on mass of oleic acid), 3 h, 78°C.
Figure 4. UV spectra of MO in the reaction system with different reaction times ((a) 1 h λmax = 402 nm; (b) 2 h, λmax = 412 nm; (c) 3 h, λmax = 420 nm) at 298 K, [MO] = 1 × 10⁻⁵ M.
![Figure 4. UV spectra of MO in the reaction system with different reaction times ((a) 1 h λmax = 402 nm; (b) 2 h, λmax = 412 nm; (c) 3 h, λmax = 420 nm) at 298 K, [MO] = 1 × 10⁻⁵ M.](/cms/asset/ad7f7af8-503d-4f9a-86dd-6e4130a76561/tgcl_a_1342001_f0004_c.jpg)
Figure 5. DLS study of the reaction system showing formation of micelles.
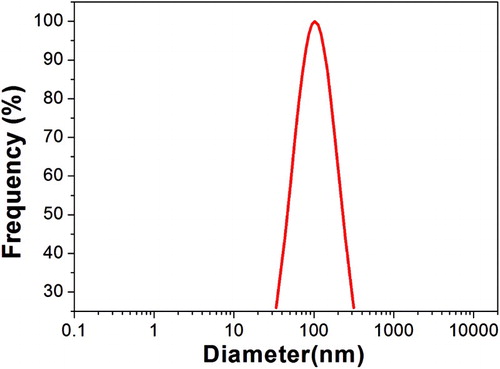
Figure 6. TEM images of the oleic acid/[SB3-12][HSO4]/ethanol system.
![Figure 6. TEM images of the oleic acid/[SB3-12][HSO4]/ethanol system.](/cms/asset/adae3b5f-2542-4919-91d6-5c4a37f3dd0c/tgcl_a_1342001_f0006_b.gif)
Figure 7. Reusability of [SB3-12][HSO4] for esterification. Reaction conditions: n (ethanol): n (oleic acid) = 1.5:1; catalyst = 5wt% (based on the mass of oleic acid), 3 h, 78°C.
![Figure 7. Reusability of [SB3-12][HSO4] for esterification. Reaction conditions: n (ethanol): n (oleic acid) = 1.5:1; catalyst = 5wt% (based on the mass of oleic acid), 3 h, 78°C.](/cms/asset/8c85a44d-f109-4352-a458-6b14ca89ed86/tgcl_a_1342001_f0007_b.gif)
Figure 8. Different stages of esterification catalyzed by [SB12-3][HSO4].
![Figure 8. Different stages of esterification catalyzed by [SB12-3][HSO4].](/cms/asset/8e7ebd13-c8e0-44b0-a33e-c813a399df20/tgcl_a_1342001_f0008_c.jpg)