
Figures & data
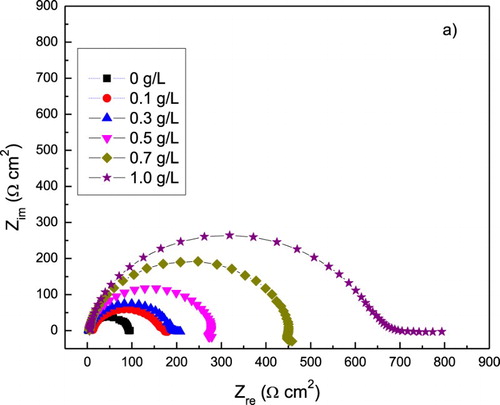
Figure 1. Microstructure of the as-received 1018 carbon steel.
Table 1. Effect of P. boldus concentration on the weight loss, inhibitor efficiency and Θ at 25°C, 40°C and 60°C.
Figure 2. (a) Tempkin and (b) Langmuir type of adsorption isotherms for 1018 carbon steel in 0.5 M H2SO4 in presence of P. boldus extract.
Figure 3. Arrhenius plot for log (ΔW) versus 1000/T for 1018 carbon steel in 0.5 M H2SO4 with 0 and 1.0 g/L of P. boldus.
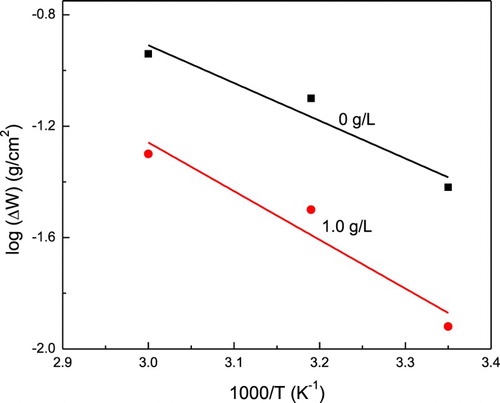
Figure 4. Effect of P. boldus concentration in the polarization curves for 1018 carbon steel in 0.5 M H2SO4 at 25°C.
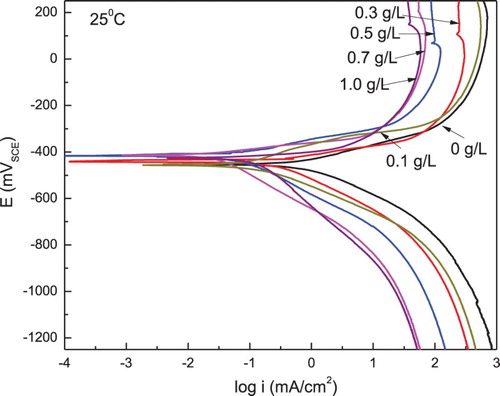
Table 2. Electrochemical parameters obtained from PC for 1018 carbon steel in 0.5 M H2SO4 at different concentrations of P. boldus at 25°C.
Figure 5. Effect of temperature in the polarization curves for 1018 carbon steel in 0.5 M H2SO4 containing 1.0 g/L of P. boldus.
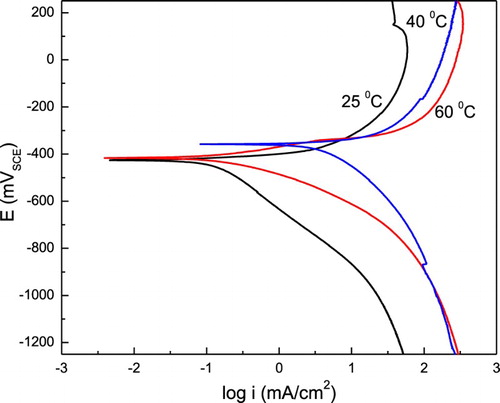
Figure 6. Effect of P. boldus concentration in the (a) Nyquist and (b) Bode curves for 1018 carbon steel in 0.5 M H2SO4 at 25°C. Symbols are experimental data, lines are the fitted results.
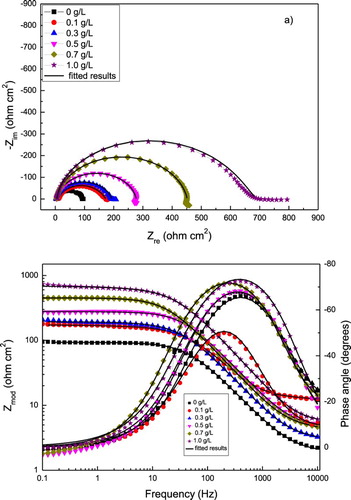
Figure 7. Electric circuits used to simulate obtained EIS data at 25°C.
Figure 8. Temkin type of adsorption isotherm for 1018 carbon steel in 0.5 M H2SO4 in presence of P. boldus extract by using data from the PC and EIS measurements.
Table 3. Electrochemical parameters used to fit EIS data shown in .
Figure 9. Effect of P. boldus concentration in charge transfer resistance, Rct and double-layer capacitance, Cdl, values for 1018 carbon steel in 0.5 M H2SO4 at 25°C.
Figure 10. Effect of temperature in the Nyquist diagrams for 1018 carbon steel in 0.5 M H2SO4 containing (a) 0 and (b) 1.0 g/L of P. boldus.
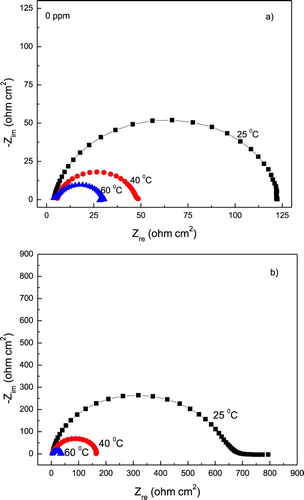
Table 4. Variation of Rct values for 1018 carbon steel in 0.5 M H2SO4 with 0 and 1.0 g/L of P. boldus together with the inhibitor efficiency as a function of testing temperature.
Figure 11. SEM micrographs of 1018 carbon steel immersed in 0.5 M H2SO4 containing 0 g/L (a, c and e) and 1.0 g/L (b, d and f) of P. boldus at 25°C (a and b), 40°C (c and d) and 60°C (e and f).
Figure 12. Chemical structure of the main components found in the methanol P. boldus extract showing (a) p-cymene, (b) limonene, (c) eucalyptol, (d) tabanone, (e) α-tocopherol (vitamin E), (f) chrysin and (g) indolo[1-1, 2]isoquinoline, 5,6,12,12a-tetrahydro-2,3,9,10-tetramethoxy (7).
![Figure 12. Chemical structure of the main components found in the methanol P. boldus extract showing (a) p-cymene, (b) limonene, (c) eucalyptol, (d) tabanone, (e) α-tocopherol (vitamin E), (f) chrysin and (g) indolo[1-1, 2]isoquinoline, 5,6,12,12a-tetrahydro-2,3,9,10-tetramethoxy (7).](/cms/asset/5d57e2e4-34de-4e53-96ab-12c06cbd6c5c/tgcl_a_1369167_f0012_b.gif)