Figures & data
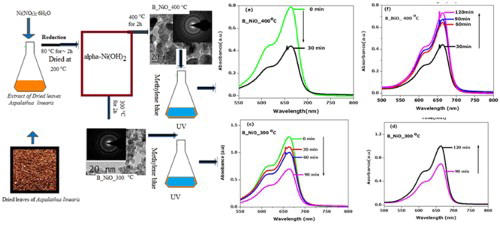
Figure 1. A schematic diagram of a formation of NiO nanocrystals using A. linearis.
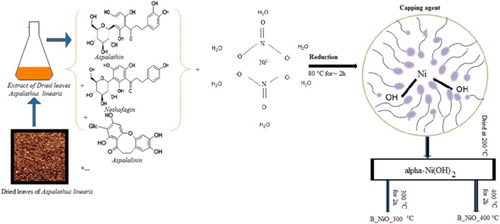
Figure 2. FTIR spectra of dried products (spectrum (a)) and the sample thermally treated at 300°C (spectrum (b)).
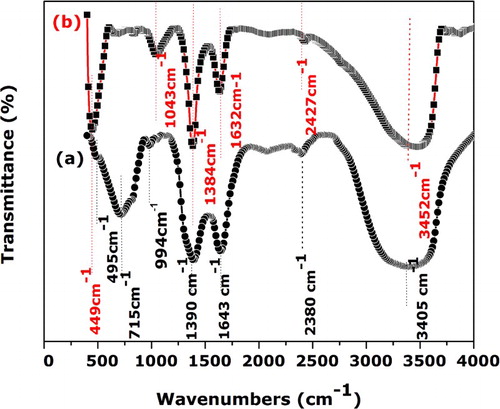
Figure 3. RT X-ray diffraction of the samples: (a) sample annealed at 200°C, and (b) samples annealed at 300°C and 400°C.
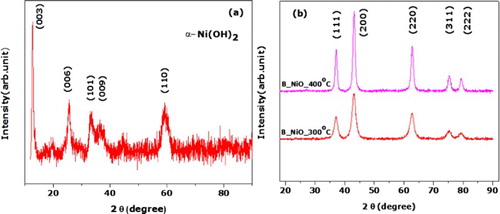
Figure 4. TEM, HRTEM, SAED and size distribution of biosynthesized NiO nanocrystals.
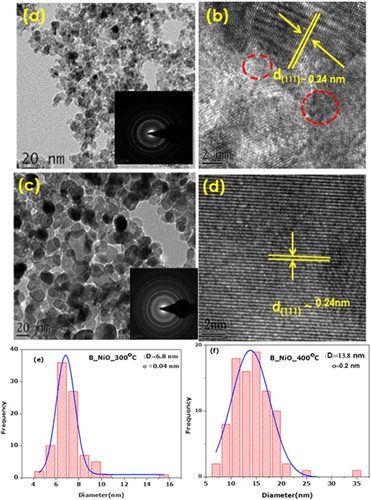
Figure 5. (a) UV–vis absorption spectrum of biosynthesized NiO nanocrystals, and (b) plot (α hυ)2 vs. hυ for the biosynthesized NiO nanocrystals.
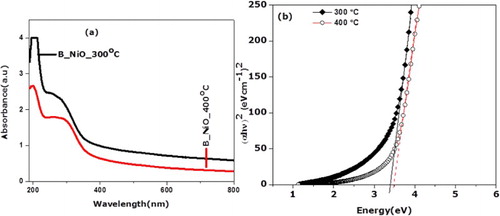
Figure 6. (a) PL spectra of biosynthesized NiO nanocrystals in the wavelength range of 258–800 nm, and (b) PL spectrum of B_NiO samples in the range of ∼258–600 nm (I < 7 cps).
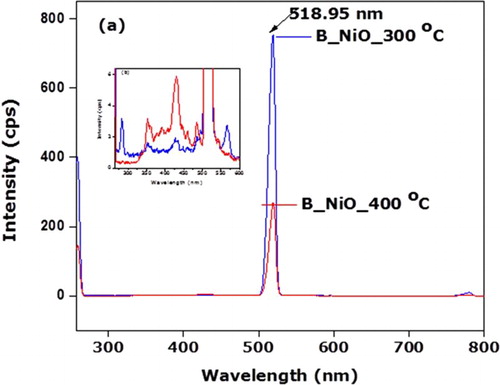
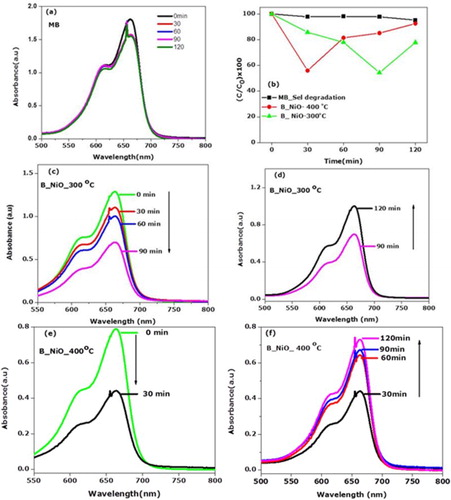
Figure 7. Light responses of biosynthesized NiO nanocrystals/water/MB system. (a) UV–visible spectra displaying the bleaching process of MB under UV radiation without biosynthesized NiO nanocrystals. (b) The plots of the ratio of MB in biosynthesized NiO nanocrystals/water/MB system vs. irradiation time. (c–f) UV–visible spectra displaying the bleaching/ recoloration process of biosynthesized NiO nanocrystals/water/MB systems.