Figures & data
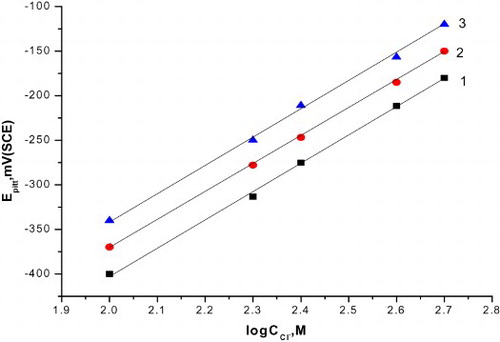
Table 1. The IUPAC name, molecular weight and molecular formula of the major component found in the three natural extracts used as green corrosion inhibitors.
Figure 1. Effect of various concentrations of cassia bark extract on the galvanostatic polarization curves for C-steel in 0.5 M H2SO4. (1) 0.00 ppm, (2) 100 ppm, (3) 200 ppm, (4) 300 ppm, (5) 400 ppm and (6) 500 ppm.
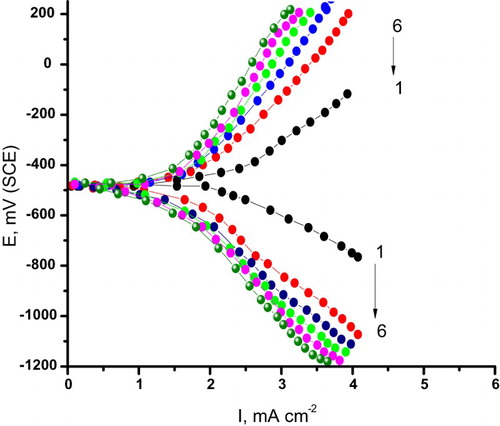
Table 2. Corrosion parameters obtained from galvanostatic polarization measurements of C-steel in 0.5 M H2SO4 solution containing different concentrations of natural extracts of curcumin, parsley and cassia bark.
Figure 2. Potentiodynamic anodic polarization curves of C-steel in 0.5 M H2SO4 containing different concentrations of cassia bark extract at a scan rate of 50 mV/s. (1) 0.00 ppm, (2) 100 ppm, (3) 200 ppm, (4) 300 ppm, (5) 400 ppm and (6) 500 ppm.
Table 3. Corrosion parameters obtained from potentiodynamic anodic polarization measurements of C-steel in 0.5 M H2SO4 containing different concentrations of natural extracts of curcumin, parsley and cassia bark at a scan rate 50 mV/s.
Figure 3. Potentiodynamic anodic polarization curves of carbon steel in 0.5 M H2SO4 + 0.5 M NaCl solutions containing different concentrations of cassia bark extract at a scan rate1 mV/s. (1) 0.00 ppm, (2) 100 ppm, (3) 200 ppm, (4) 300 ppm, (5) 400 ppm and (6) 500 ppm.
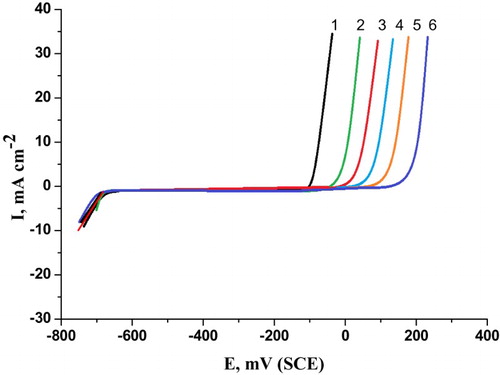
Figure 4. The relation between the pitting potential of C-steel and logarithm the concentration of natural extracts. (1) Curcumin extract, (2) parsley extract and (3) cassia bark extract.
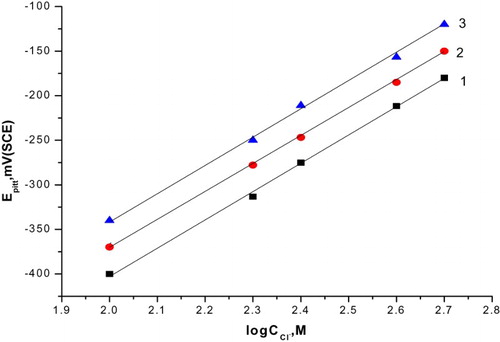
Figure 5. Weight loss as a function of time of C-steel in 0.5 M H2SO4 solution without and with cassia bark extract: (1) 0.00 ppm, (2) 100 ppm, (3) 200 ppm, (4) 300 ppm, (5) 400 ppm and (6) 500 ppm.
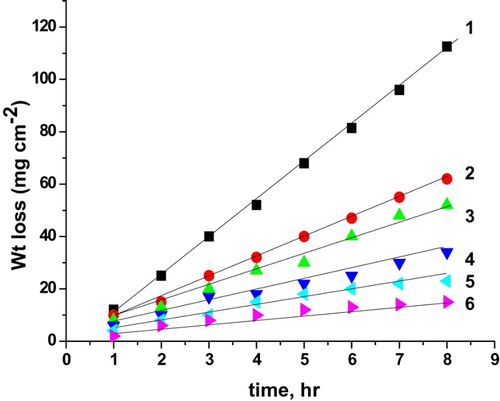
Table 4. Variation of degree of surface coverage (θ), corrosion rate (k) and percentage inhibition efficiency (%IE) of C-steel in the presence of different concentrations of curcumin, parsley and cassia bark extracts.
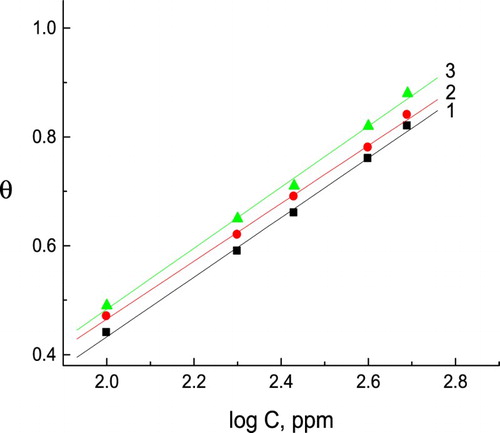
Figure 6. Curve fitting of the corrosion data for C-steel in 0.5 M H2SO4 solution in presence of different concentrations of natural extracts to the Temkin’s adsorption isotherm. (1) Curcumin extract, (2) parsley extract and (3) cassia bark extract.