Figures & data
Figure 1. Chemical structure of 2-ME.
Figure 2. Schematic diagram of the flow injection CL system used for the determination of 2-ME. a, luminol; b, 2-ME; c, K3 Fe(CN)6; d, CDs; P1 and P2, peristaltic pump; V, injection valve; F, flow cell; D, detector; PC, luminescence analyzer controlled by personal computer; W, waste.
Figure 3. (a) HRTEM image of CDs. (b) HRTEM images of single CDs. (c) Size distribution of CDs by DLS analysis.
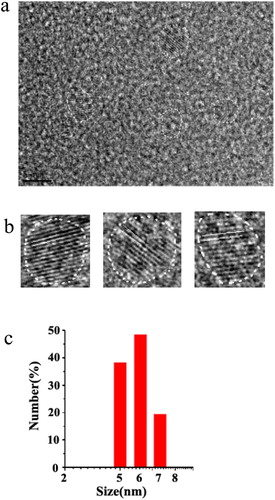
Figure 4. (A) UV-Vis absorption spectrum of CDs. The inset is the photograph of the CDs under visible light (left) and under 365 nm UV light (right). (B) Fluorescence spectra for CDs excited at wavelengths of 300–480 nm, with increments of 20 nm.
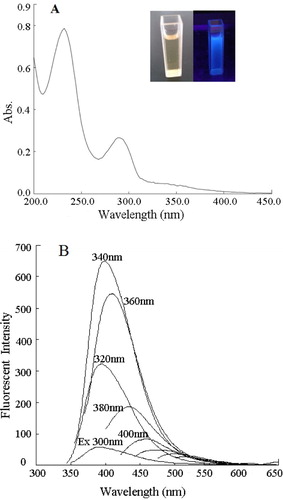
Figure 5. Kinetic CL intensity-time profile in the static system. 1, luminol-K3Fe(CN)6; 2, CDs-luminol-K3Fe(CN)6; 3, CDs-luminol-K3Fe(CN)6-2-ME. Conditions: luminol, 5.0×10⁻⁷ mol L-1 (0.05 mol L-1 NaOH); K3Fe(CN)6, 5.0×10⁻⁷ mol L-1; CDs, 2.0×10⁻⁴ (VCDs/VH2O); 2-ME, 2.5×10⁻⁸ gmL-1.
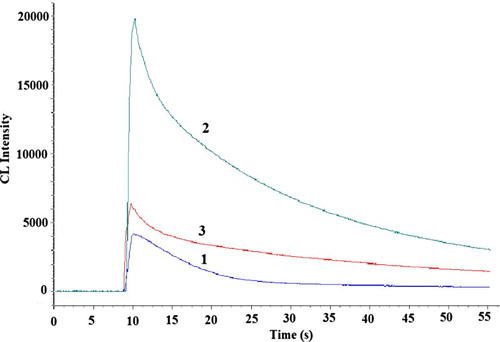
Figure 6. Effect of NaOH, luminol, K3Fe(CN)6 and CDs concentration on the CL intensity for 5.0×10⁻⁷ g mL-1 2-ME. Conditions: (a) K3Fe(CN)6, 5.0×10⁻⁵ mol L-1; luminol, 2.0×10⁻⁶ mol L-1; CDs, 6.0×10⁻⁴ (VCDs/VH2O); (b) K3Fe(CN)6, 5.0×10⁻⁵ mol L-1; NaOH, 0.2 mol L-1; CDs, 6.0×10⁻⁴ (VCDs/VH2O); (c) luminol, 2.0×10⁻⁶ mol L-1; NaOH, 0.2 mol L-1; CDs, 6.0×10⁻⁴ (VCDs/VH2O); (d) luminol, 2.0×10⁻⁶ mol L-1; NaOH, 0.2 mol L-1; K3Fe(CN)6, 5.0×10⁻⁵ mol L-1.
Figure 7. CL spectra of the reaction. 1, luminol-K3Fe(CN)6; 2, CDs-luminol-K3Fe(CN)6; 3, CDs-luminol-K3Fe(CN)6-2-ME. Conditions: luminol, 5.0×10⁻⁵ mol L-1 (NaOH 0.2 mol L-1); K3Fe(CN)6, 5.0×10⁻⁵ mol L-1; CDs, 4.0×10⁻⁴ (VCDs/VH2O); 2-ME, 5.0×10⁻⁷ g mL-1.
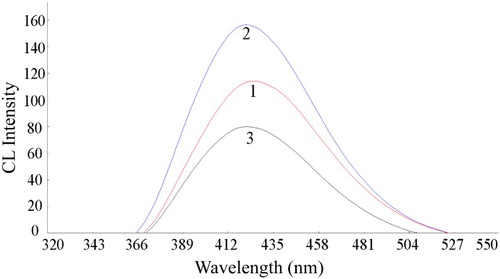
Figure 8. UV-Vis absorption spectra. 1, 2-ME; 2, CDs; 3, luminol-K3Fe(CN)6; 4, CDs-luminol -K3Fe(CN)6; 5, CDs-luminol-K3Fe(CN)6-2-ME. Conditions: luminol, 8.0×10⁻⁵ mol L-1 (NaOH 0.1 mol L-1); K3Fe(CN)6, 1.0×10⁻⁴ mol L-1; CDs, 2.0×10⁻² (VCDs/VH2O); 2-ME, 3.0×10⁻⁵ g mL-1.
Scheme 1. Possible mechanism of CL reaction catalyzed by CDs.