Figures & data
Table 1. Compositions of prototypical formulations.
Table 2. Particle size in the test formulations.
Figure 1. Turbidity of the formulations as a function of hop cone extract concentration.
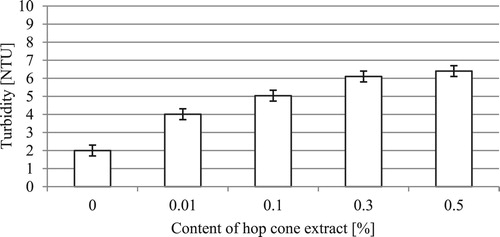
Table 3. Mean values of colorimetric parameters for the test formulations.
Figure 2. Changes in the total color difference (ΔE*) of the formulations as a function of hop cone extract concentration.
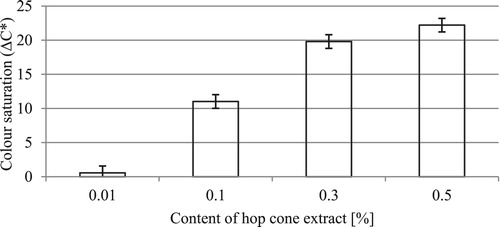
Figure 3. Antimicrobial activity of the test formulations against S. aureus ATCC 25923 (a); disc saturated with a formulation containing hop cone extract at the concentration of 0.5% (b).
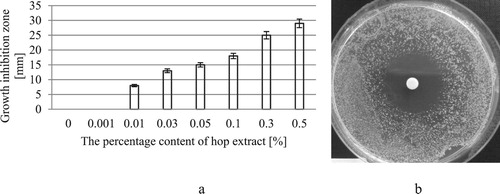
Figure 4. Viable bacterial count and reduction of viable bacterial count.
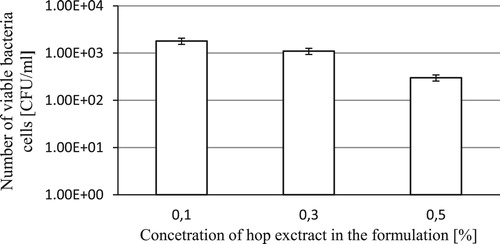
Figure 5. Irritant effect of the formulations as a function of hop cone extract concentration.
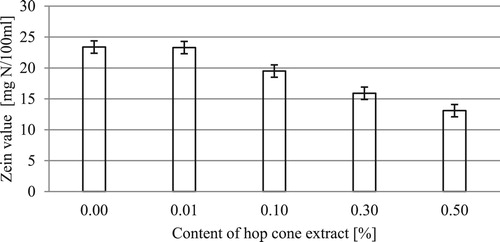
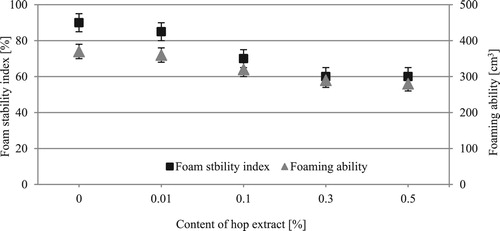
Figure 6. Foaming properties of prototypical formulations.