
Figures & data
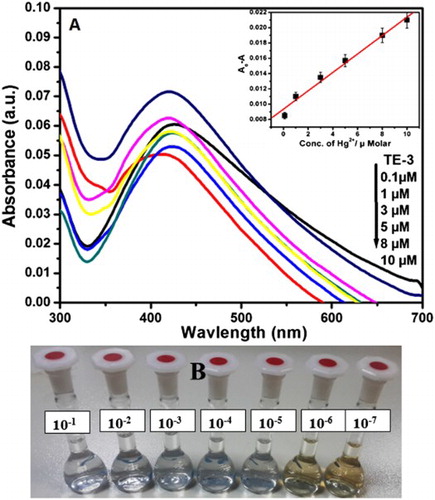
Figure 1. UV–visible spectra of extract and prepared AgNPs and the inset shows the images of extract and TE-3.
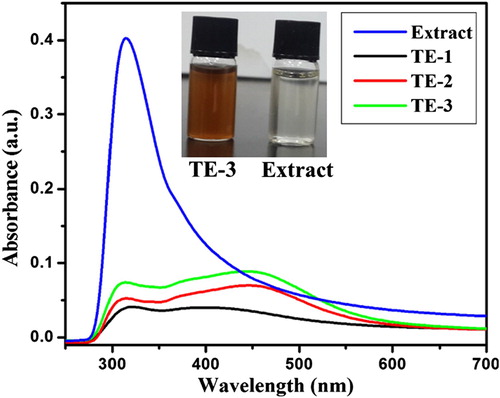
Figure 2. SEM images and corresponding EDX for TE-1, TE-2, and TE-3 (a–c).
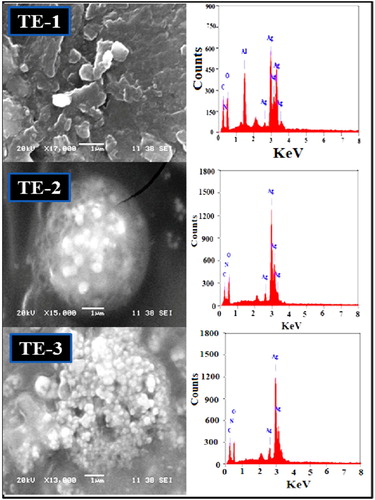
Figure 3. FTIR spectra of extract and prepared AgNPs.
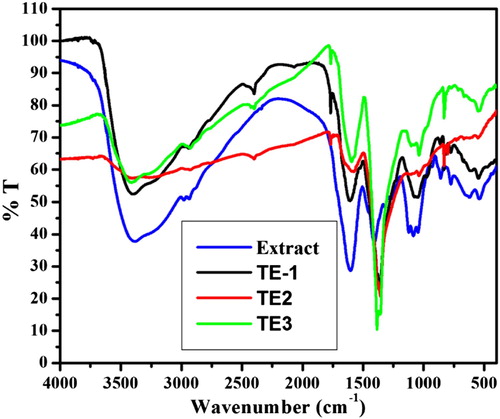
Figure 4. (A) UV–visible spectra of AgNPs with different metal ions (10−3 M) in aqueous solution (B) and (C) paper-based colorimetric sensing and images of selective sensing of Hg2+ ion by AgNPs in aqueous solution.
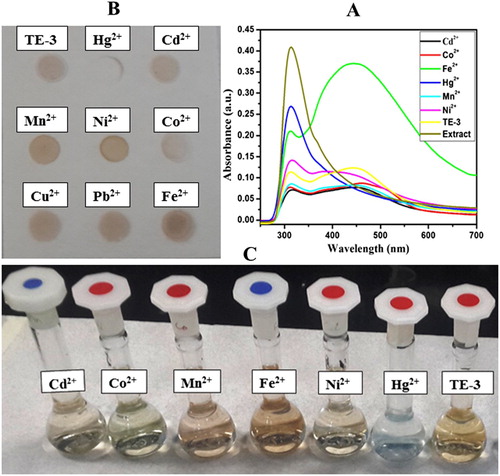
Figure 5. (A) UV–visible spectra of AgNPs with different concentrations of Hg2+ (0.1–10 µM) in aqueous solution (inset). Variation of the absorbance of AgNPs solution as a function of Hg2+ ion concentration. (B) Images of color variations of AgNPs with different concentrations of Hg2+ (10−1–10−7 M) in aqueous solution.
