Figures & data
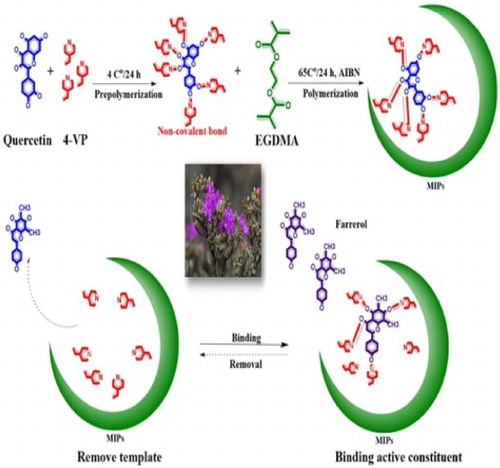
Figure 1. The chemical structures of farrerol, quercetin and the image of R. aganniphum.
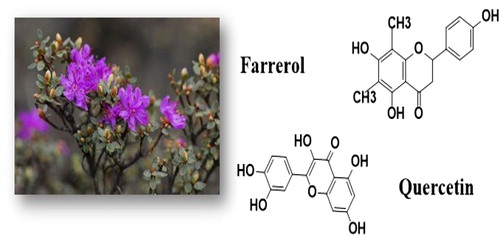
Figure 2. Ultraviolet spectra obtained with different molar ratios between quercetin and 4-vinylpyridine.
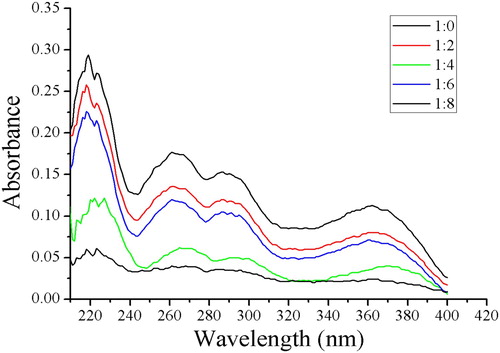
Figure 3. Schematic diagram of the preparation and adsorption procedure with the dummy molecularly imprinted polymers.
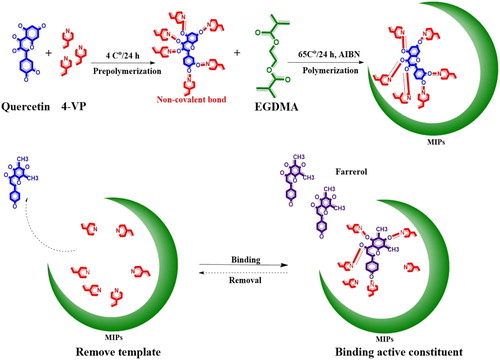
Figure 4. SEM images of the d-NIP (a, c) and d-MIP (b, d).
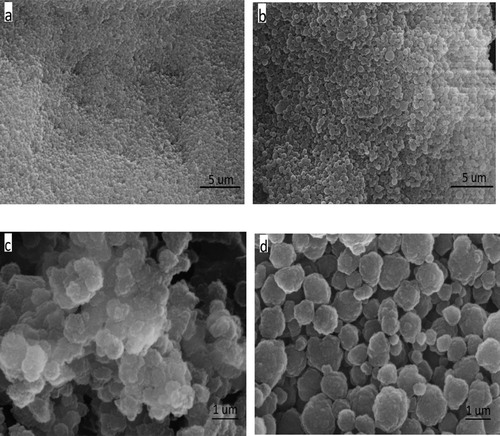
Figure 5. FTIR spectra of the template (quercetin, a), d-MIP with adsorbed quercetin, d-NIP with adsorbed quercetin, and d-MIP with adsorbed farrerol (b).
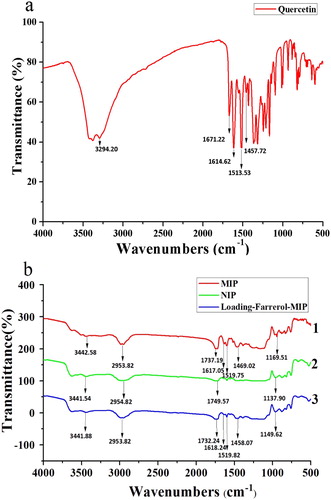
Figure 6. Dynamic curves (a) and adsorption isotherms (b) for the adsorption of farrerol by the d-MIP and d-NIP.
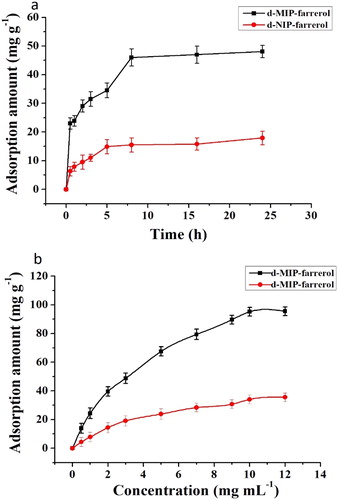
Figure 7. Scatchard plots of the d-MIP (a) and d-NIP (b).
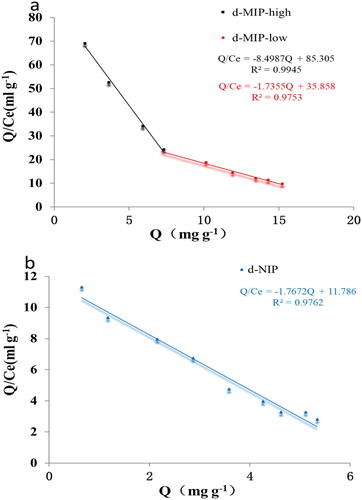
Table 1. The maximum adsorption capacity (Qmax) and imprinting factor (IF) obtained from the Scatchard plots.
Table 2. Selectivity of the d-MIP and d-NIP for farrerol, kaempferol, and matrine compared with those for quercetin (n = 3).
Figure 8. HPLC-UV chromatogram of farrerol (a). Ethanol extraction of R. aganniphum leaves before MISPE (b). Washing with carbon tetrachloride (CCl4) (c), methylene chloride (CH2Cl2) (d), and n-hexane (e). Elution with MeOH–acetic acid (80%, MeOH volume fraction) (f).
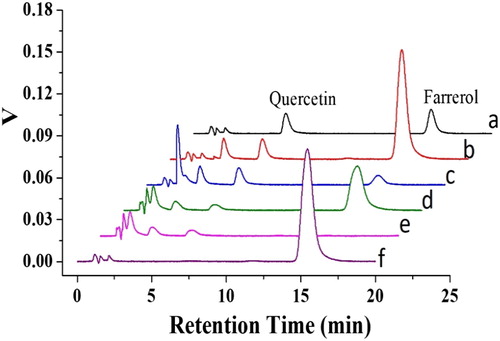
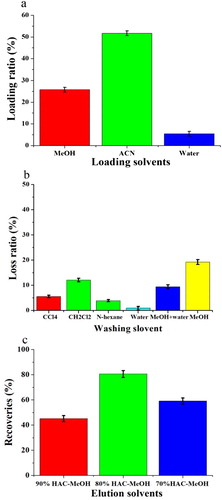
Figure 9. The loading ratio (a), loss ratio (b), and recoveries (c) obtained with the d-MISPE cartridges in the optimized procedure.