
Figures & data
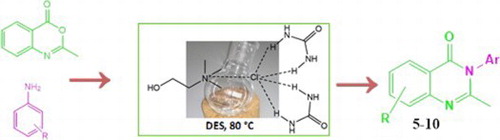
Figure 1. The quinazolinone structures core ( Citation12).
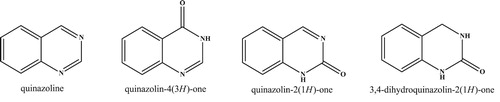
Figure 2. Some marketed anticancer drugs with quinazoline moiety.
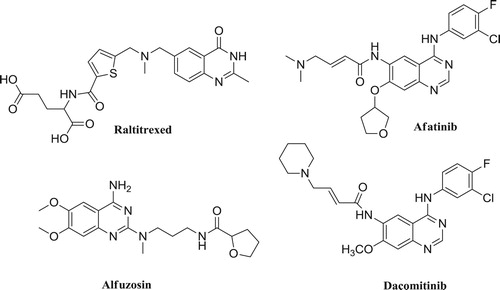
Figure 3. Synthetic path for synthesis of desired derivatives.
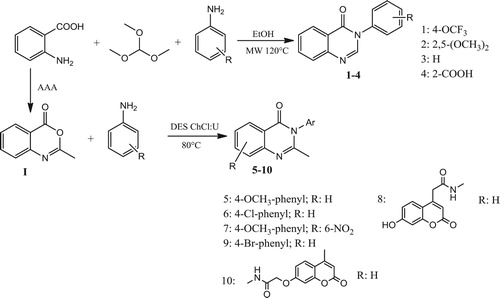
Figure 4. A proposed mechanism for synthesis of 3-substituted quinazolin-4(3H)-ones.
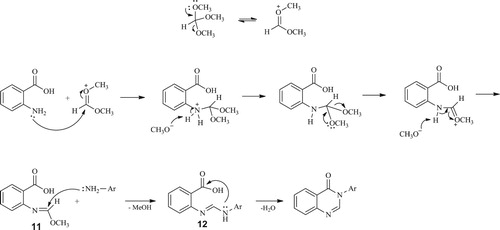
Figure 5. A proposed mechanism for benzoxazinone synthesis.
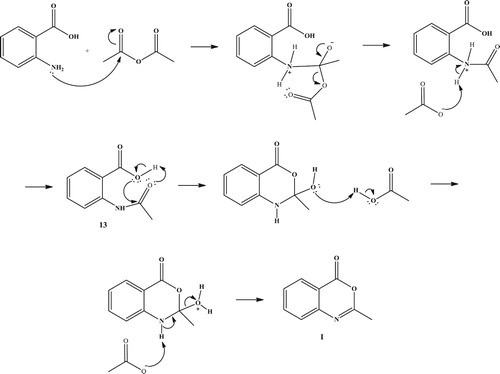
Figure 6. A plausible mechanism of 2-methyl-3-substituted-quinazolin-4(3H)-ones formation.
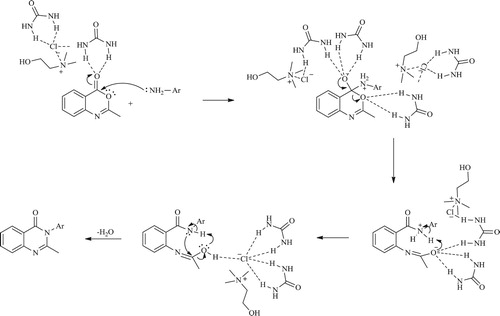
Table 1. Calculated IC50 values [μM] for two affected cancer cell lines and two non-cancerous cell lines as control for synthesized compounds.
Supplemental material