Figures & data
Figure 1. Health effect of fluoride ion on people in the Dugda Bora district, East Shoa Ethiopia. Photos taken from ‘Aanaa Dugdaa Booraa; shawaa Bahaa; Oromiyaa’.
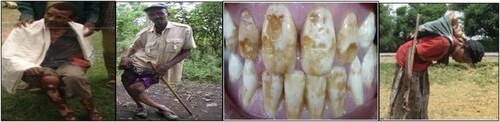
Figure 2. Fluoride distribution (Citation12).
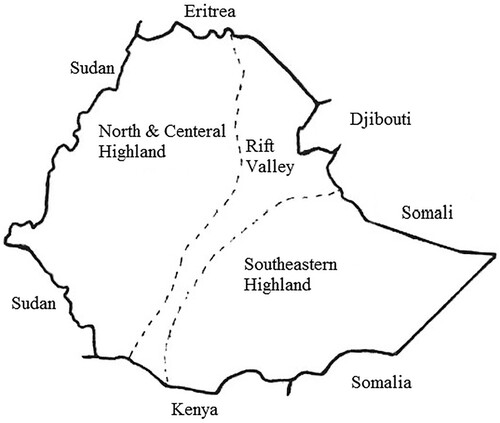
Table 1. Fluoride remediation experience in Ethiopia (Citation12).
Figure 3. Setup for arc discharge technique.
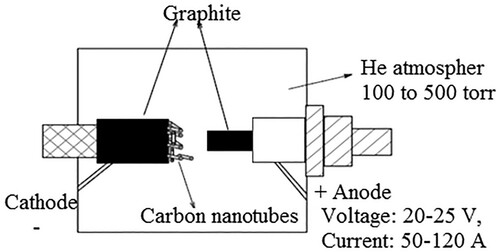
Figure 4. Laser ablation scheme.
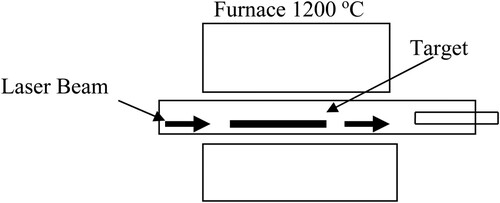
Figure 5. Experimental CVD equipment setup.
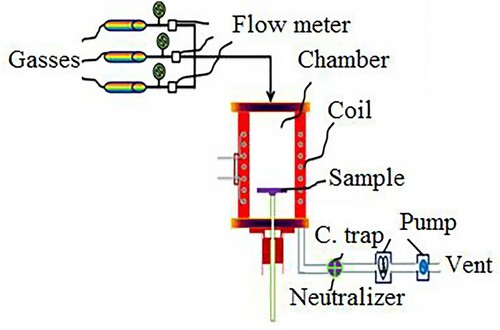
Figure 6. The FESEM images of CNTs obtained by green method using walnut extract (Citation28).
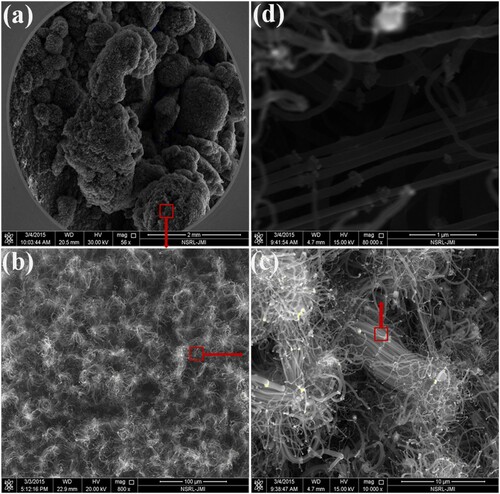
Figure 7. Diffusion ways of CNTs growth with metal catalyst: (a) VLS and (b) VSS mechanism.
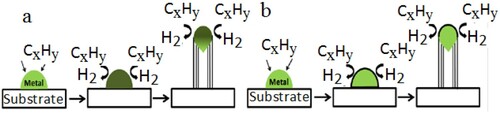
Figure 8. Interaction strength between catalyst particles and substrate CNTs growth: (a) tip-growth (b) base-growth model.
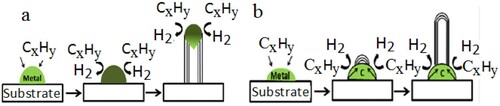
Table 2. The objectives of few characterization techniques of CNTs.
Figure 9. Flow chart for size boundary, pressure range and types of material separated in filtration technology (Citation59).
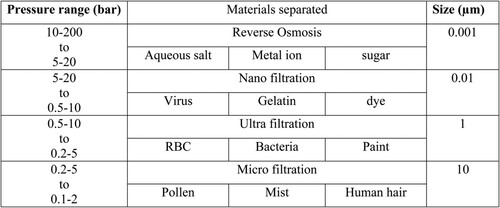
Table 3. Driving forces and their related membrane separation processes.
Figure 10. Principle of reverse osmosis.
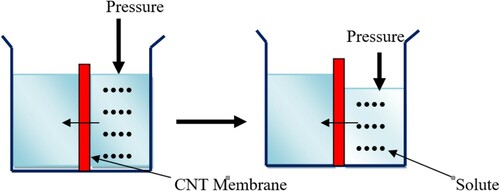
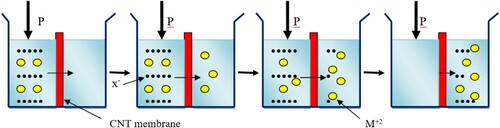
Figure 11. Charge balance mechanism by Donnan effect.