
Figures & data
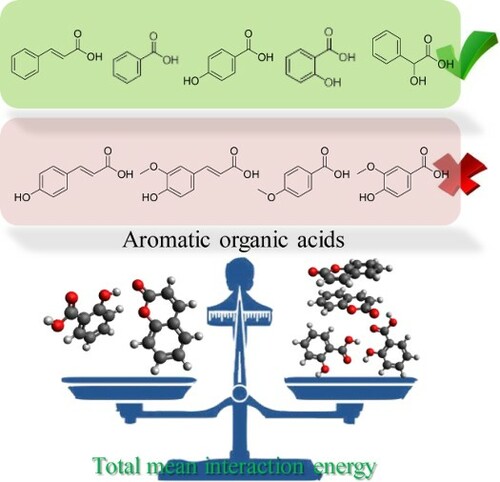
Figure 1. The predicted solid–liquid equilibrium phase diagrams (full line) by COSMO-RS, the ideal liquidus diagrams (dashed line) and the experimental eutectic points at different mole fractions (▪).
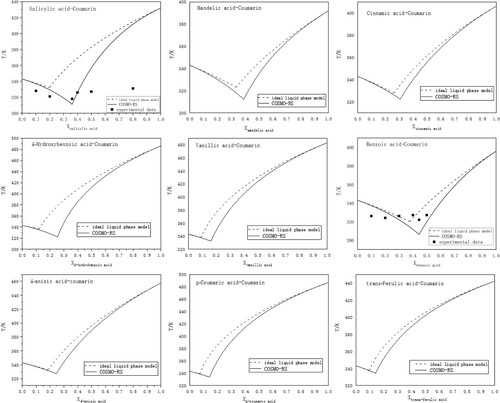
Table 1. Compounds used for the preparation of deep eutectic solvents and their melting properties.
Figure 2. FTIR spectra for pure sources (A) and the obtained eutectic solvent systems (B). Aromatic organic acids/coumarin molar ratio 1:3.
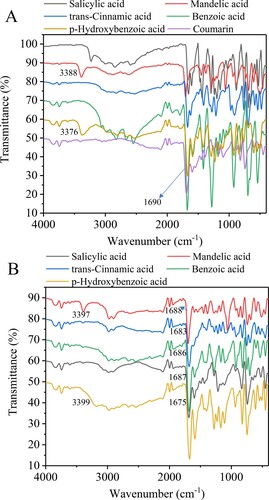
Figure 3. 1H NMR chemical shifts of starting materials (A) and the obtained eutectic solvent systems (B). Aromatic organic acids/coumarin molar ratio 1:3.
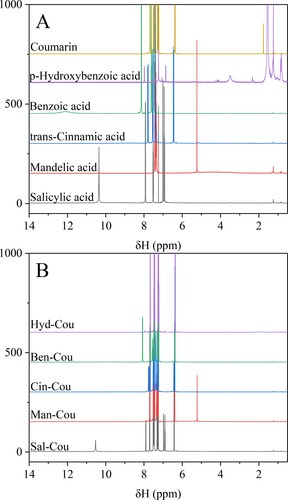
Figure 4. Binding energy and its physical components calculated at SAPT2+/aug-cc-pVDZ level in the pure substances (A) and the eutectic solvent systems (B).
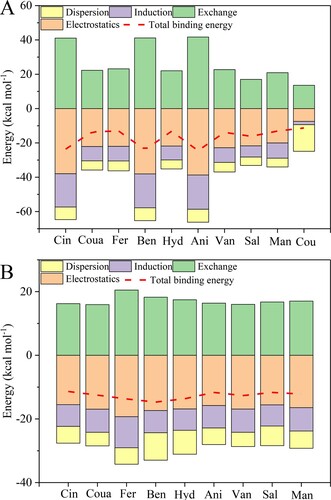
Table 2. Total mean interaction energy (E) obtained by COSMO-RS.