
Figures & data
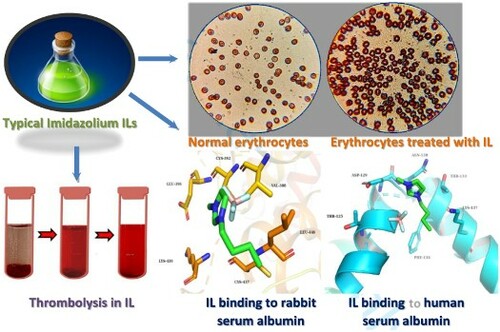
Figure 1. (a) Blood clotting index, (b) hemolysis rate, (c) hemoglobin concentration, (d) conductivity and (e) serum protein concentration of blood with [Bmim]Br, [Bmim]Cl, [Bmim]BF4 and [Bmim]PF6.
![Figure 1. (a) Blood clotting index, (b) hemolysis rate, (c) hemoglobin concentration, (d) conductivity and (e) serum protein concentration of blood with [Bmim]Br, [Bmim]Cl, [Bmim]BF4 and [Bmim]PF6.](/cms/asset/3bc2617e-87f2-48ed-8b52-f375ab45c2e5/tgcl_a_2102439_f0001_oc.jpg)
Figure 2. (a) Blood clotting index, (b) hemolysis rate, (c) hemoglobin concentration, (d) conductivity and (e) serum protein concentration of blood with [Emim]PF6, [Bmim]PF6 and [Omim]PF6.
![Figure 2. (a) Blood clotting index, (b) hemolysis rate, (c) hemoglobin concentration, (d) conductivity and (e) serum protein concentration of blood with [Emim]PF6, [Bmim]PF6 and [Omim]PF6.](/cms/asset/654f88f6-581d-424c-bd3c-77d5c7f942cb/tgcl_a_2102439_f0002_oc.jpg)
Figure 3. Erythrocyte morphology (a) without the IL and that treated with (b) [Bmim]PF6 and (c) [Omim]PF6; (d) erythrocyte sedimentation (±0.01 mm) of blood with ionic liquids ① [Emim]PF6, ② [Bmim]PF6, ③ [Omim]PF6 and ④ without IL; thrombolytic rate of (e) ILs (10 mg/mL) at different time, and (f) different [Emim]PF6 dose in 2 mL PBS at 3 h.
![Figure 3. Erythrocyte morphology (a) without the IL and that treated with (b) [Bmim]PF6 and (c) [Omim]PF6; (d) erythrocyte sedimentation (±0.01 mm) of blood with ionic liquids ① [Emim]PF6, ② [Bmim]PF6, ③ [Omim]PF6 and ④ without IL; thrombolytic rate of (e) ILs (10 mg/mL) at different time, and (f) different [Emim]PF6 dose in 2 mL PBS at 3 h.](/cms/asset/36f5c0b2-e21f-43c8-8569-19f16102b9e8/tgcl_a_2102439_f0003_oc.jpg)
Figure 4. (a) UV spectra with different [Bmim]BF4 concentrations; (b) fluorescence spectra with different [Bmim]BF4 concentrations and the fluorescence of the combined solution without or with 10 μM [Bmim]BF4 under 280 nm; (c) IR spectra of RSA with different [Bmim]BF4 concentrations; (d) the absorbance of the complex formed by the mixture of [Bmim]BF4 and two kinds of serum albumin at 278 nm; molecular docking diagram of the interactions between [Bmim]BF4 (green, blue, pink and cyanic sticks) and (e) RSA amino acid residues (yellow fragments) or (f) HSA amino acid residues (cyanic fragments).
![Figure 4. (a) UV spectra with different [Bmim]BF4 concentrations; (b) fluorescence spectra with different [Bmim]BF4 concentrations and the fluorescence of the combined solution without or with 10 μM [Bmim]BF4 under 280 nm; (c) IR spectra of RSA with different [Bmim]BF4 concentrations; (d) the absorbance of the complex formed by the mixture of [Bmim]BF4 and two kinds of serum albumin at 278 nm; molecular docking diagram of the interactions between [Bmim]BF4 (green, blue, pink and cyanic sticks) and (e) RSA amino acid residues (yellow fragments) or (f) HSA amino acid residues (cyanic fragments).](/cms/asset/4a9b16b3-d7e0-427f-bff1-c7c0e993c319/tgcl_a_2102439_f0004_oc.jpg)