Figures & data
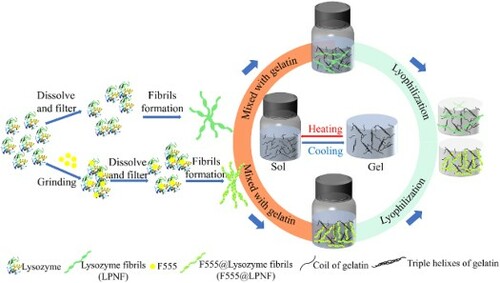
Figure 1. Schematic illustration of aerogel-based formed from gelatin and LPNFs or F555@LPNFs.
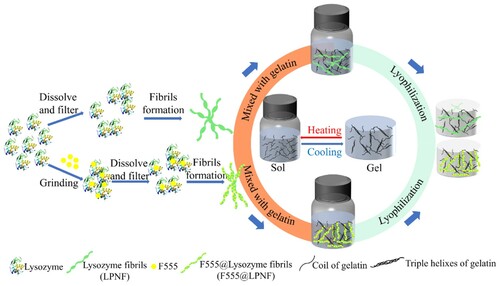
Figure 2. AFM micrographs (a–b) and fibril length distribution (c–d) of LPNF and F555@LPNF.
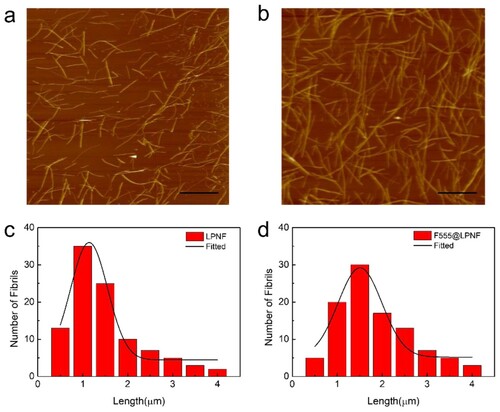
Figure 3. (a–b) Photographs of samples of LPNF (or F555@LPNF) and gelatin mixed in different ratios. (c) Photographs of aerogels formed from LPNF:GEL-0.5 and F555@LPNF:GEL-0.5. (d) Compression behavior of the F555@LPNF:GEL-0.5 aerogel. (e) Deformation behavior of LPNF:GEL-0.5 and dyes@LPNF:GEL-0.5 aerogels.
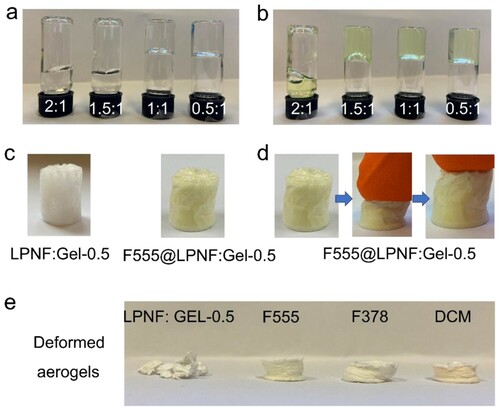
Figure 4. Rheological measurements of dynamic frequency sweep of the LPNF:GEL (a) and F555@LPNF:GEL (b) co-assembled gels at a strain of 1% over a range of 0.1–100 Hz.
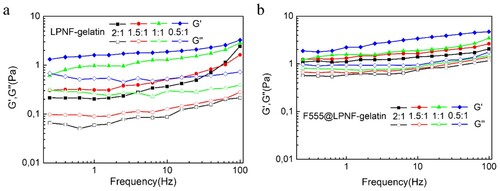
Figure 5. Rheological measurements of dynamic strain sweep of the LPNF gel (a) and F555@LPNF (b) co-assembled gels at a constant frequency of 1 Hz over a strain range of 0.1–10,000%.
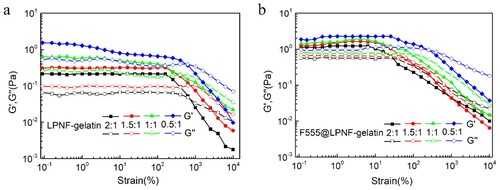
Figure 6. SEM images of aerogels. (a–c) Top-view of gelatin (a) LPNF:GEL-0.5 (b) F555@LPNF:GEL-0.5 (c) aerogels. (d–f) Cross-section of gelatin (d) LPNF:GEL-0.5 (e) F555@LPNF:GEL-0.5 (f) aerogels, scale bar is 10 μm.
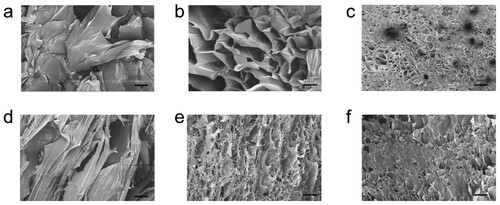
Table 1. Comparative results aerogels.
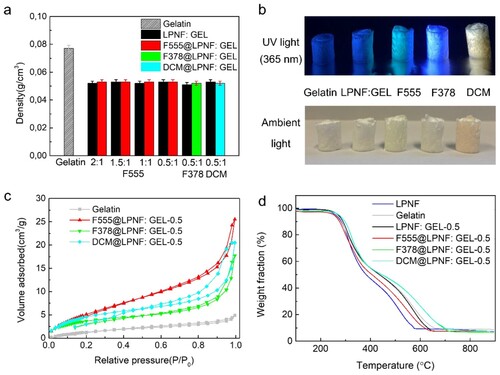
Figure 7. (a) Density of the aerogels with the different ratio of LPNF or Dyes@LPNF (F555, F378, DCM) and gelatin. (b) Photos of aerogels under UV light (365 nm) and ambient light samples. (c) Nitrogen gas absorption–desorption curve of gelatin and LPNF matrix aerogels. (d) TGA curves of amyloid fibril aerogel under nitrogen atmospheres. The residue obtained after the complete decomposition is remaining salts in the system.