Figures & data
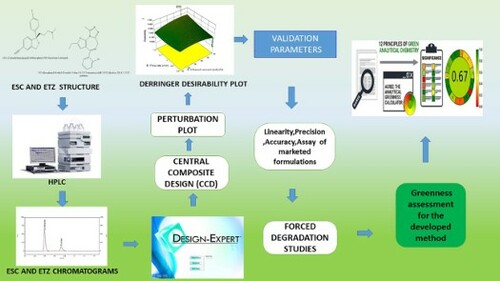
Figure 1. Structure of ESC and ETZ.
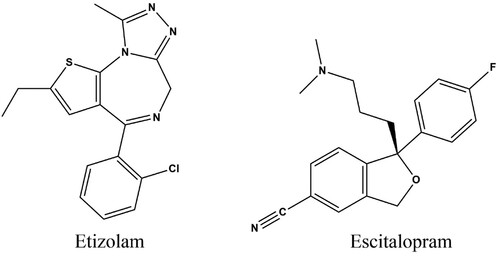
Figure 2. Standard ESC and ETZ chromatograms.
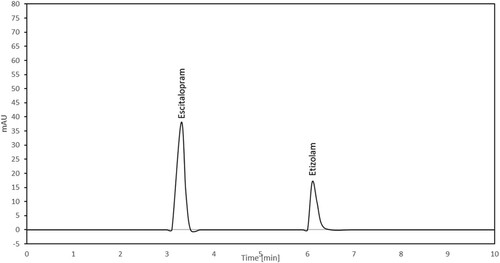
Table 1. CCD experimental design and measured responses.
Table 2. ANOVA and Regression summary of models.
Figure 3. (a) Drug effects capacity factors – ESC, ETZ – shown in a perturbation graph. (b) Diagram displaying the Retention time of drugs – ESC, ETZ. (c) Perturbation graph showing the Retention of drugs – ESC, ETZ.
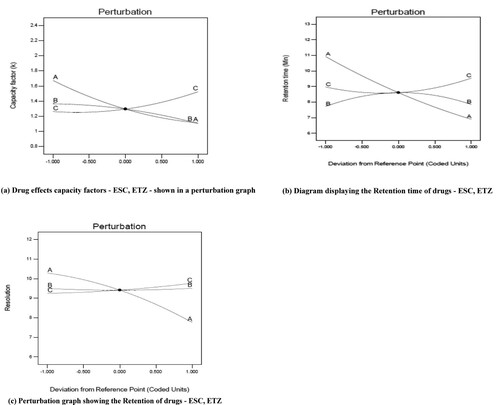
Figure 4. Graphical representation of the overall desirability function.
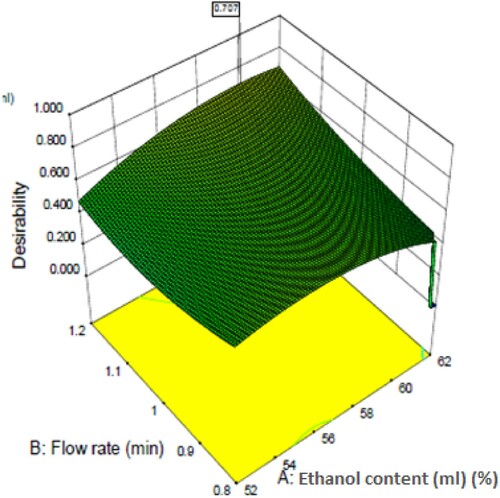
Table 3. Compared predicted and experimental values.
Figure 5. Sample chromatogram of ESC and ETZ.
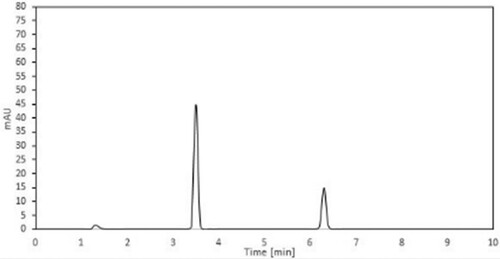
Table 4. Validation of analytical parameters using HPLC.
Figure 6. (a) Blank. (b) Acid Hydrolysis. (c) Alkali Hydrolysis. (d) Oxidation. (e) Photo Degradation. (f) Dry Heat. (a-f) Typical Chromatogram of ESC and ETZ (10 mg/mL) with Stress test.
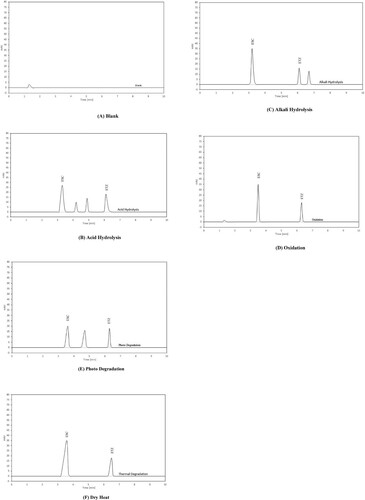
Table 5. Forced degradation studies of ESC and ETZ.
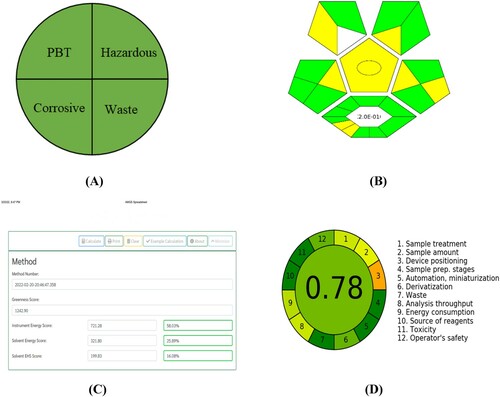
Figure 7. (a) NEMI, (b) GAPI, (c) AMGS, and (d) AGREE with metric Results of the suggested green assessment method.