
Figures & data

Figure 1. Schematic representations of Musa acuminata fruit peel extract.
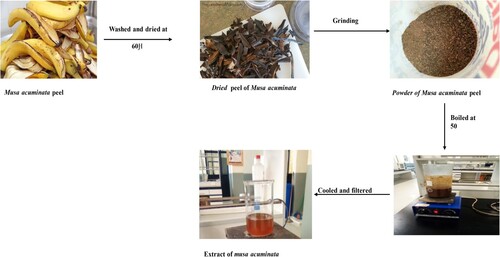
Figure 2. Schematic green synthesizes representation of ZnO/CuO NCs (20%).
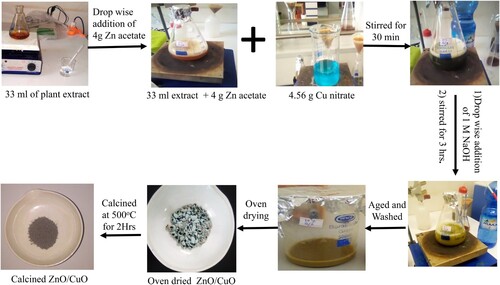
Figure 3. Schematic degradation of MB under visible light irradiation in the presence of green nanocatalyst.
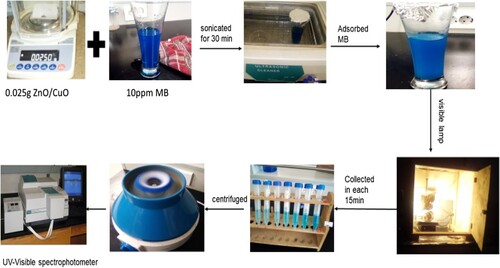
Figure 4. (a) TGA-DTA curve of as-synthesized ZnO; (b) CuO NPs.
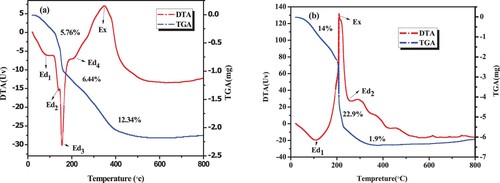
Figure 5. (a) XRD spectra of synthesized ZnO within (1:1, 1:2, and 1:3) NPs and (b) CuO NPs and ZnO/CuO (10%, 15%, 20% and 25%) NCs.
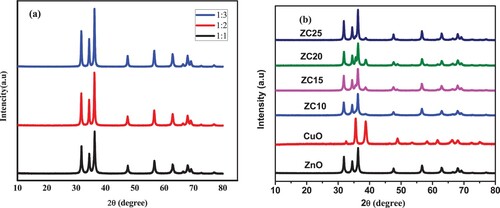
Table 1. Average crystallite size of green synthesized NPs and NCs.
Figure 6. SEM image of ZnO NPs (1:1, 1:2, and 1:3) represented by (a), (b), and (c), respectively, CuO NPs (d), ZnO/CuO NCs (10%, 15%, 20% and 25%) represented by (e), (f), (g) and (h), respectively, which was synthesized in the presence of Musa acuminata peel extract.
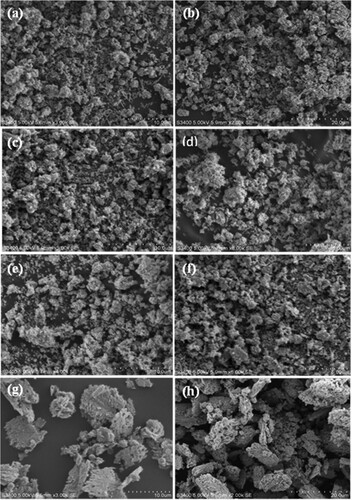
Figure 7. TEM micrograph of (a) ZnO (1:1) NPs, (b) CuO NPs, (c) ZnO/CuO (20%) NCs, (d) HRTEM image of ZnO (1:1) NPs, (e) HRTEM image of CuO NPs and (f) HRTEM image of ZnO/CuO (20%) NCs.
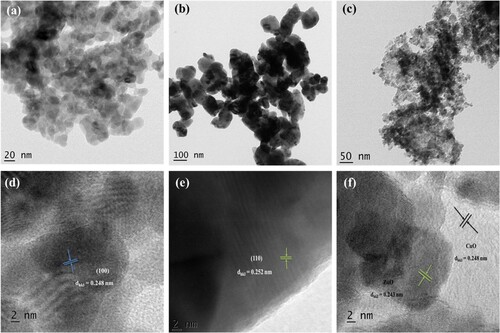
Figure 8. SAED pattern of (a) ZnO (1:1) NPs, (b) CuO NPs, and (c) ZnO/CuO (20%) NCs.
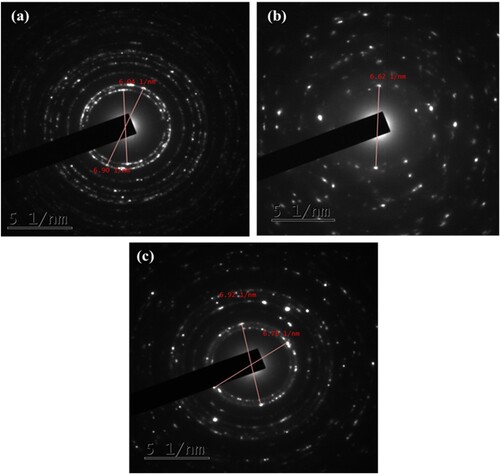
Figure 9. (a) UV-Vis DRS spectra of ZnO NPs; (b) Tauc plot of ZnO NPs; (c) UV-Vis DRS spectra of ZnO NPs, CuO NPs, and ZnO/CuO NCs; (d) Tauc plot of ZnO NPs, ZnO/CuO NCs and that of CuO NPs in the inset.
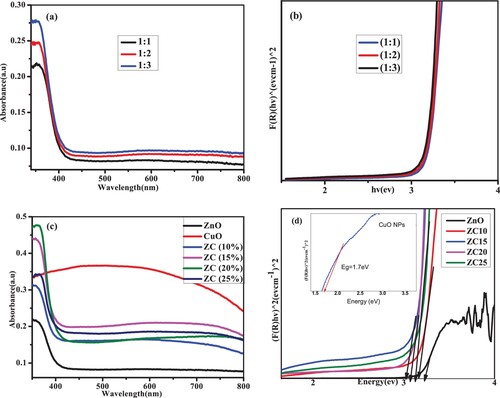
Figure 10. FTIR spectra of BP extract, uncalcined ZnO and CuO NPs, calcined ZnO and CuO NPs and ZnO/CuO (20%) NCs.
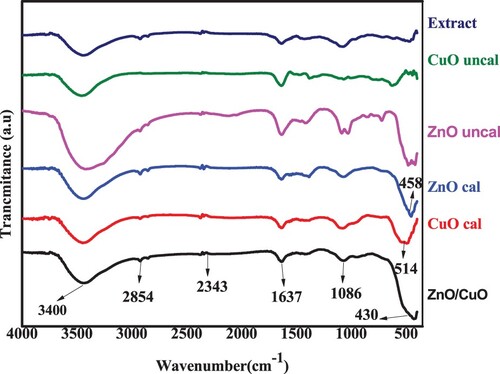
Figure 11. MB dye degradation under visible light irradiation in the presence of (a) ZnO and (b) CuO green nanocatalysts.
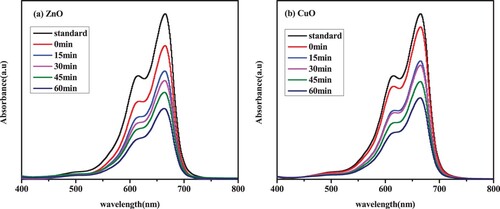
Figure 12. MB dye degradation under visible light irradiation in the presence of (a) ZC10, (b) ZC15, (c) ZC20 and (d) ZC25 green NCs catalyst.
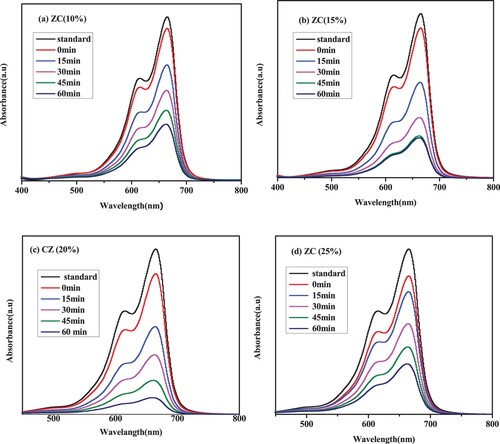
Figure 13. MB dye color fading upon addition of green ZC20 catalyst.
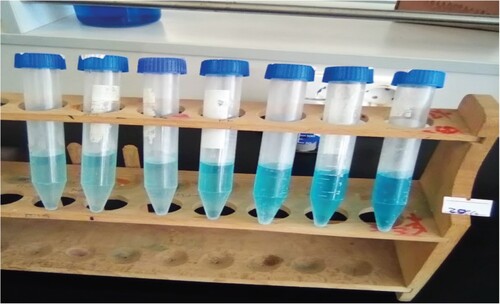
Figure 14. (a) MB dye degradation using green catalysts; (b) kinetics of MB dye degradation; (c) rate constant of MB dye degradation.
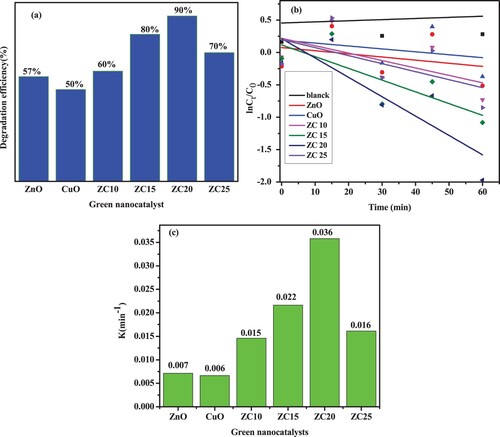
Table 2. Rate constant and degradation efficiency of ZnO, CuO, and ZnO/CuO green nanocatalysts-based MB dye under visible light irradiation.
Table 3. Calculated first order kinetic data model.
Figure 15. Photodegradation rate kinetics of MB dye at a, different pH and b, corresponding degradation efficiency.
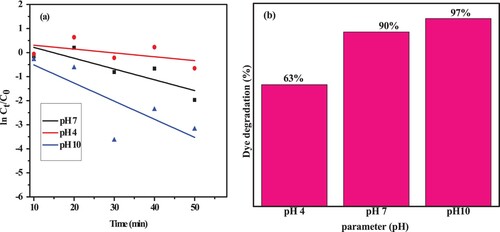
Figure 16. (a) Photodegradation rate kinetics of MB with various ZnO/CuO (20%) NCs catalyst dosage; (b) corresponding degradation efficiency.
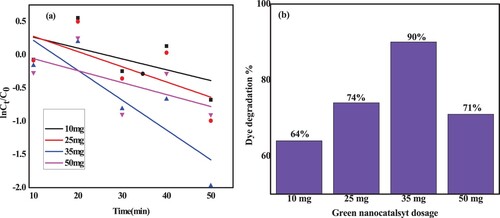
Figure 17. (a) Photodegradation rate kinetics of MB using ZC green catalyst with various initial dye concentrations and (b) corresponding photocatalytic degradation efficiency.
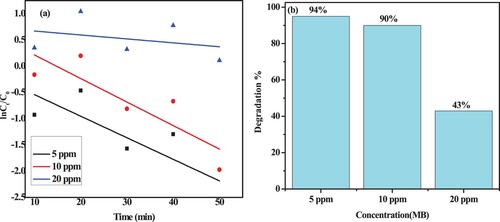
Figure 18. Schematic diagram for photodegradation mechanism of MB dye by ZC green nanocatalysts.
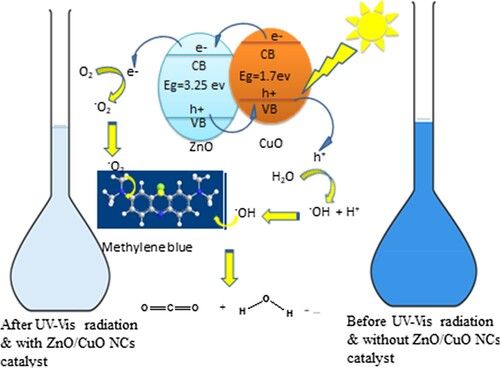
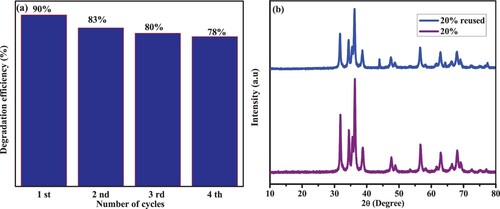
Figure 19. (a) Degradation of MB in four cycles under visible irradiation; (b) XRD result of ZC20 photocatalyst after reused four times.
Data availability statement
The research data used to support the findings of this study are included in the article.