
Figures & data

Table 1. The main variables and the related three levels.
Table 2. Factors affecting lipid production and their levels.
Table 3. The main variables and the corresponding three levels affecting biodiesel production.
Figure 1. Description of changes in color during the biosynthesis of Au@Ag NPs.
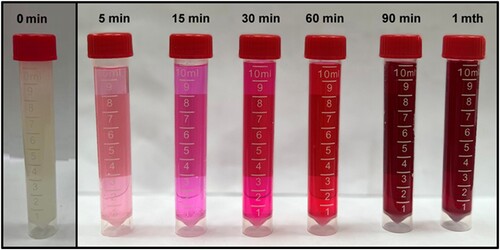
Figure 2. UV–visible spectrum of Au@Ag NPs biosynthesized by A. terreus KC462061
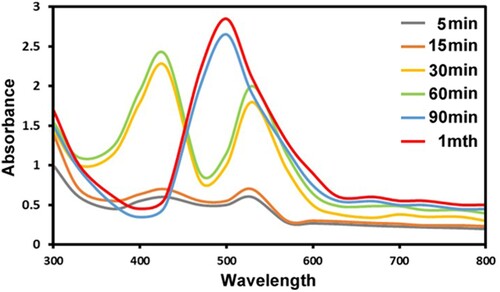
Figure 3. TEM image showing the morphology of Au@Ag NPs.
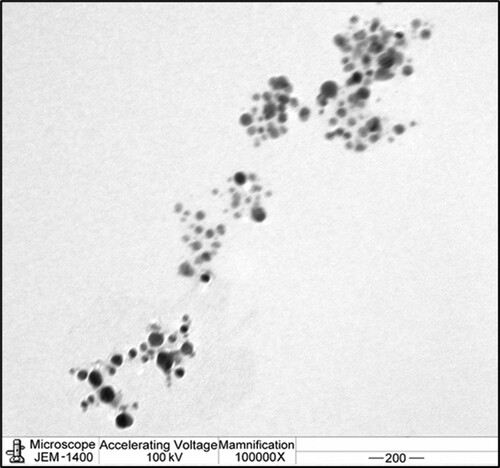
Figure 4. XRD pattern analysis of Au@Ag NPs.
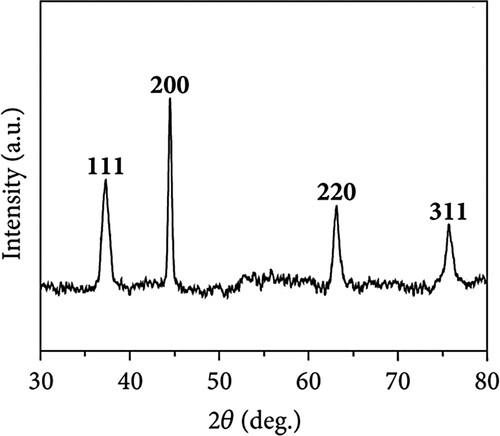
Figure 5. FTIR spectrum of Au@Ag NPs.
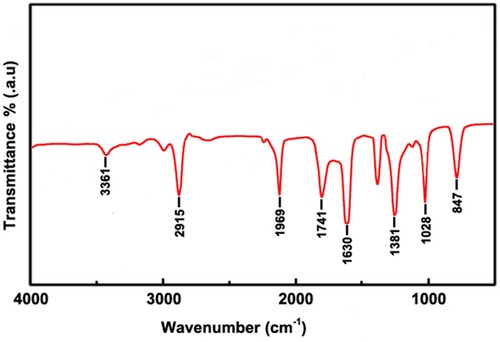
Table 4. FTIR wave numbers for different peaks of Au@Ag NPs.
Figure 6. EDS spectrum of Au@Ag NPs synthesised
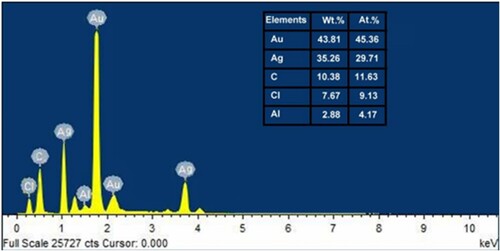
Table 5. RSM matrix with experimental and predicted responses.
Table 6. ANOVA values and statistical analysis by response surface model fitting.
Table 7. Comparison between experimental and estimated lipid production.
Table 8. The optimal variables at maximum lipid production (41.83%).
Table 9. Factors affecting biodiesel production using transesterification process.
Table 10. ANOVA for response surface methodology.
Figure 7. GC-MS analysis of the fatty acid methyl ester mixture.
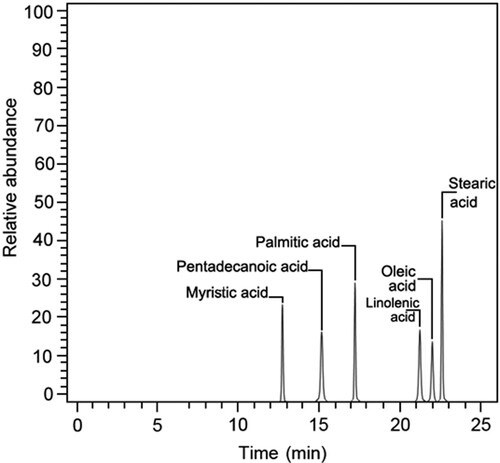
Table 11. GC-MS analysis of fatty acid esters profile.
Table 12. Properties of the produced biodiesel compared to international standards.
Table 13. Biodiesel yield from different oils using various nanocatalysts.