
Figures & data

Figure 1. UV–vis spectra of bioreduction of Ag+ ions and the intensity of color duringAgNPs production at (A) color changes after 10 minutes and (B) UV–vis spectra of biosynthesized VJ@AgNPs.
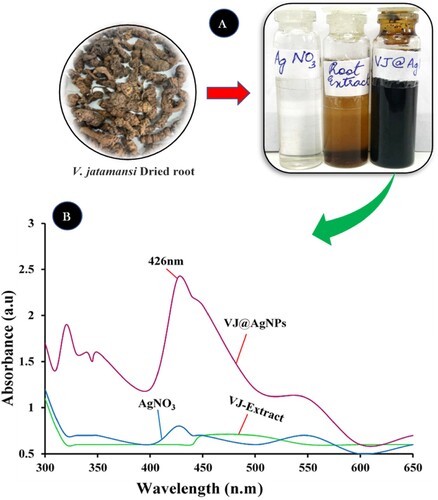
Figure 2. XRD spectrum of synthesized VJ@AgNPs by aqueous extract of V.jatamansi
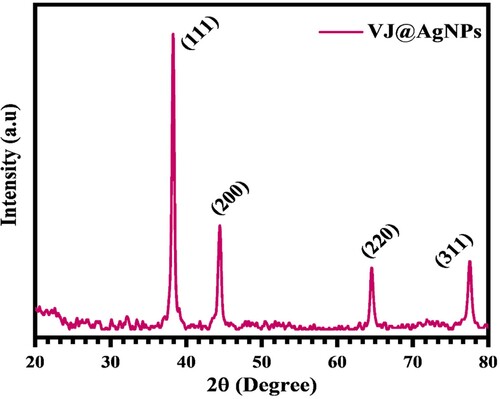
Figure 3. FT-IR Analysis of V. jatamansi root aqueous extract mediated biogenic synthesized VJ@AgNPs.
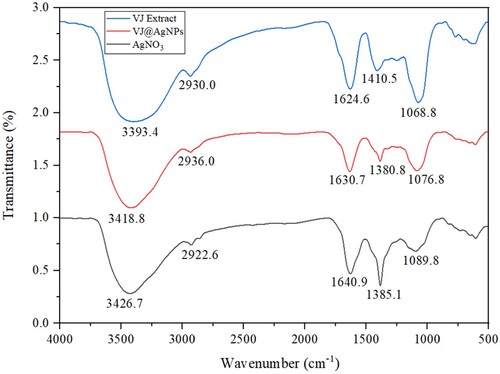
Figure 4. (A-C) displays a HRTEM image of a region of the sample, while Figure s (B) and (C) show the size distribution of the nanoparticles. (D) SAED image of VJ@AgNPs.
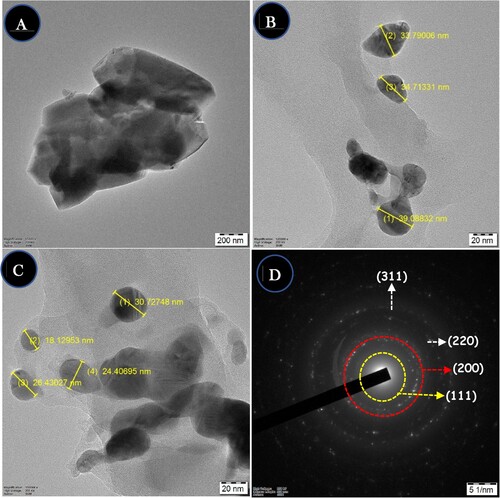
Figure 5. EDX analysis showed that the synthesized silver nanoparticles were composed of 100% elemental silver (Ag) (inserted), confirming the purity of the synthesized VJ@AgNPs.
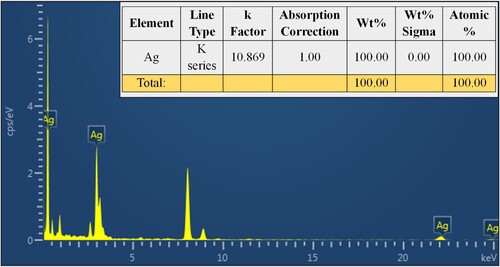
Figure 6. (A) Size distribution reports by intensity and (B) zeta potential of biosynthesized VJ@AgNPs.
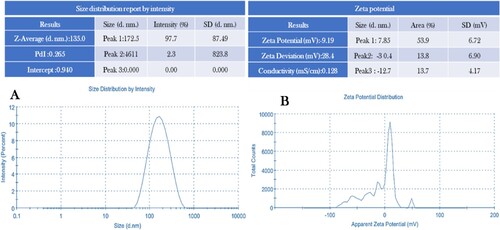
Figure 7. (A–F). Visible clear zone produced by V. jatamansi root aqueous extract and biosynthesized VJ@AgNPs against three species of foodborne pathogen: (A) E. coli, skin infective pathogen (B) S. aureus, and human oral cavity pathogen (C) Streptococcus mutans. Positive control streptomycin was used all the tested pathogens.
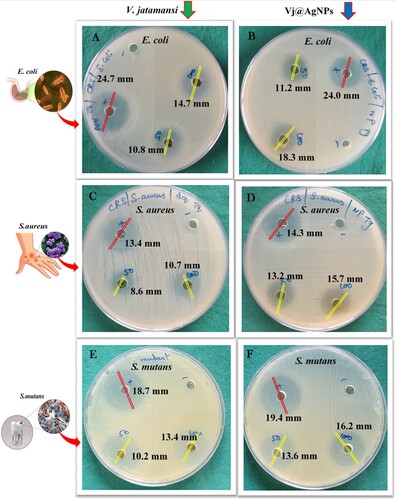
Figure 8. Antibiofilm activity of V. jatamansi root extract and biosynthesized VJ@AgNPs. Biofilm formed by (EC) Escherichia coli, (SA) Staphylococcus aureus, (SM) Streptococcus mutans, (PC) Streptomycin was used as positive control, and (C) control untreated, staining with crystal violet. After 24 h biofilm formation and inhibition were measured as optical density at 600 nm
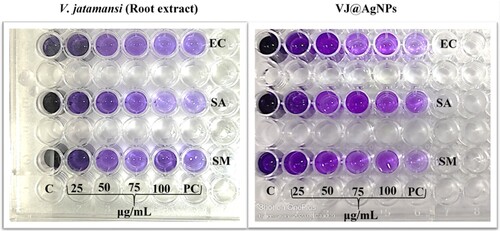
Figure 9. Inhibitory effects of V. jatamansi and biosynthesized VJ@AgNPs on biofilm formation of (A) Escherichia coli, (B) Staphylococcus aureus, and (C) Streptococcus mutans. The data were presented as the mean ± SD (n = 3) of three independent experiments. * p < 0.05, ** p < 0.0001.
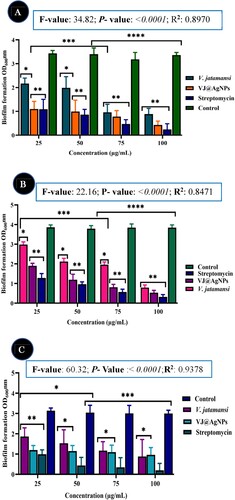
Figure 10. A. Free radical scavenging activity of different concentrations of aqueous root extract of V. jatamansi and VJ@AgNPs using DPPH scavenging effect. Data represents the results of experiments done in triplicates, n = 3. Values are the mean ± standard deviation of three independent experiments. An asterisk (*, **) represents a significance difference when compared to control values at *p < 0.05. B. ABTS radical scavenging activity. Data represents the results of experiments done in triplicates, n = 3. Values are the mean ± standard deviation of three independent experiments. An asterisk (*, **) represents a significance difference when compared to control values at *p < 0.05. C. Reducing power activity (FRAP). Data represents the results of experiments done in triplicates, n = 3. Values are the mean ± standard deviation of three independent experiments. An asterisk (*, **) represents a significance difference when compared to control values at *p < 0.05.
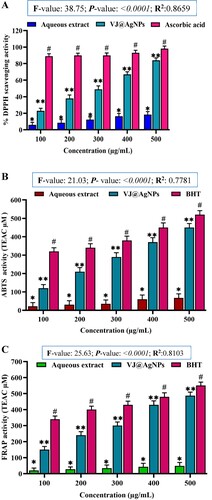
Figure 11. UV–vis absorption spectra of photodegraded RhB solutions during photo-catalytic experiment at given time intervals.
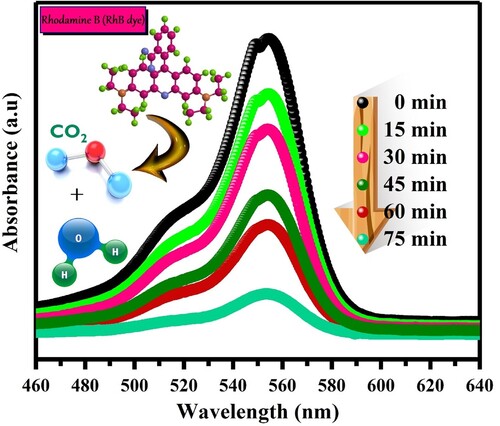
Figure 12. (a). Effect of solar light irradiation time on the degradation performance, (b) Kinetic trends for photodegradation by the synthesized photocatalysts of RhB.
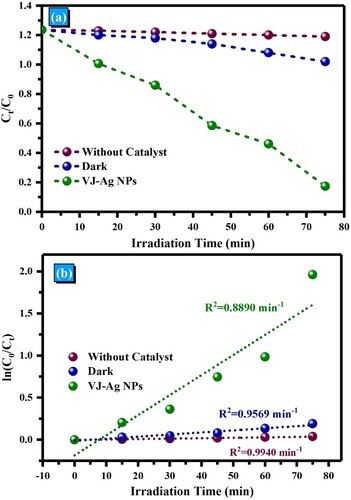
Figure 13. Recyclability of the VJ@AgNPs for decomposition of RhB dye.
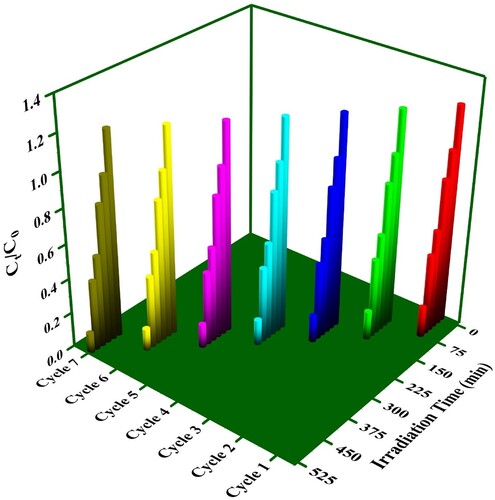
Table 1. Degradation of RhB by AgNPs obtained from previous studies.
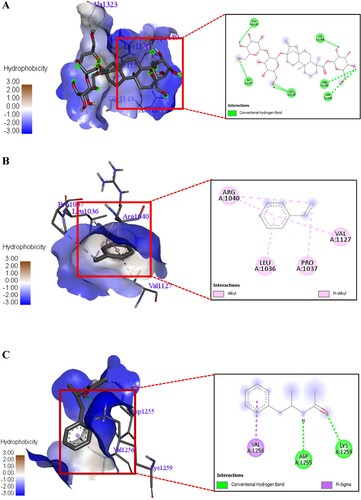
Figure 14. A 3D and 2D interaction of Stevioside with Streptococcus mutans Antigen I/II carboxy-terminus protein. B. 3D and 2D interaction of Styrene with Streptococcus mutans Antigen I/II carboxy-terminus protein. C. 3D and 2D interaction of Acetamide, N-(α-methylphenethyl) with Streptococcus mutans Antigen I/II carboxy-terminus protein.
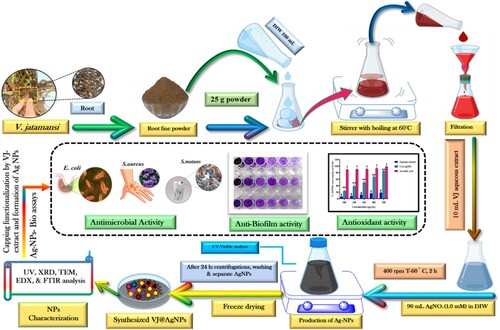
Scheme 1. Schematic for the making of biogenic VJ@AgNPs, their characterization, and capping determination using various procedures in combination with Valeriana jatamansi root aqueous extract.
Supplemental Material
Download MS Word (82.8 KB)Data availability statement
Data available on request from the corresponding author.