Figures & data
Figure 1. Map of eastern Finnmark showing the baited camera stations on the Varanger Peninsula (dots), the Nordkinn Peninsula (squares and stars for outer and inner Nordkinn Peninsula, respectively) and Laksefjordvidda (triangles). Small rodent trapping plots are denoted with white squares. The locations of three areas where breeding of avian predators in summer and snow tracks of mammals in winter were surveyed are shown as hatched areas. The distribution of Arctic fox dens is shown as grey shadings by means of density kernels (created using a quadratic kernel function in ArcGIS 10.2.2. Sub-Arctic forest is shown as dark green areas.
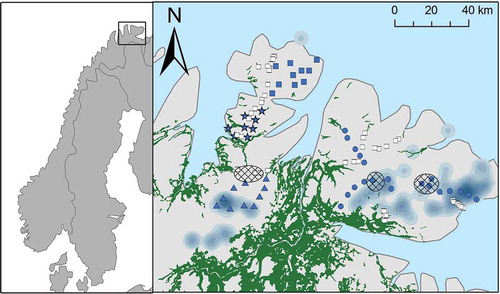
Figure 2. Depiction of the main components of plant-based vertebrate food webs on the Varanger Peninsula (modified from Ims, Ehrich et al. Citation2013). The size of the boxes reflects our current knowledge about the relative functional importance of the different species and functional groups. Only major trophic relationships are represented by lines. For vertebrates, mainly boreal forest species are shown in red, species found in both boreal forest and Arctic tundra are shown in brown, while typically Arctic tundra species are shown in pale blue.
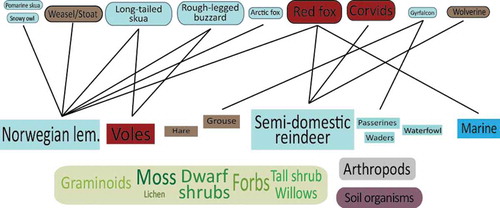
Figure 3. (a) Time series of Arctic fox and red fox occupancy rates based on baited camera-trap stations on the Varanger Peninsula, where red fox culling took place, and Laksefjordvidda (100 km to the south-west of Varanger Peninsula; see ), without culling. The estimates are obtained from occupancy models for which true absence from camera stations can be distinguished from non-detection by incorporating presence/absence and detection/non-detection as two distinct components in the model (Henden et al. Citation2014). We allowed the detection probabilities to vary between years. (b) The number of red foxes culled by field inspectors of the Norwegian Environment Agency and volunteers.
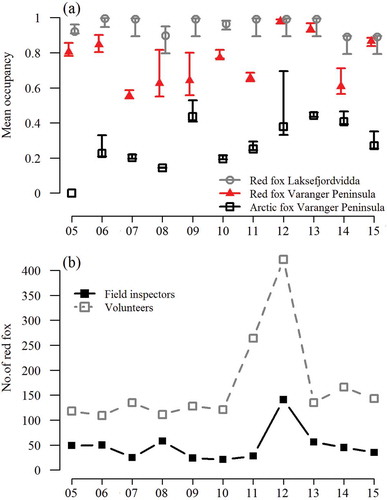
Table 1. Annual population size estimates and the underlying sample statistics for the Arctic fox on the Varanger Peninsula based on DNA extracted from scat samples collected at dens in late winter. The population size estimates were obtained from capwire, a capture–mark–recapture modelling approach allowing for heterogeneous (Two-Innate Rates Model) capture probability across individuals (Miller et al. Citation2005; Pennell et al. Citation2013). Ninety-five percent confidence intervals are provided in parentheses.
Figure 4. Time series of rodent densities and predator breeding performances on the Varanger Peninsula. (a) Rodent population density indices (individuals per 100 trap-nights) based on all small-quadrat sampling sites on the Varanger Peninsula in June (see ). (b) Litter and pup production for the Arctic fox obtained from the Norwegian den monitoring programme (Berteaux et al. Citation2017). (c) Density of successfully breeding pairs of long-tailed skua in four study blocks of 4 km2 and (d) number of rough-legged buzzard clutches with nearly fledged young in late July at traditional breeding sites in two survey areas in the interior of the peninsula (see and Killengreen et al. Citation2013).
Figure 5. Relations between annual Arctic fox reproductive output (black dots denote mean litter size and circles denote number of litters) and density (individual per 100 trap-nights in June) of (a) the Norwegian lemming and (b) the grey-sided vole.
Figure 6. Time series of main components of red fox winter diet, according to three distance zones from coast line on the Varanger Peninsula. The diets are based on wet weights of stomach contents of red foxes culled in winter (January–April). Dynamics of Norwegian lemmings and voles (sum of grey-sided voles and tundra vole) based on density indices from the preceding early summer (see ) are superimposed on the diet graphs.
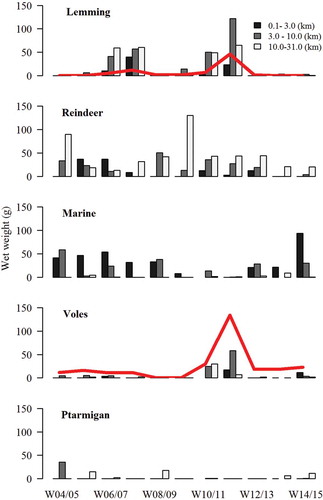
Figure 7. Fox diet width depicted as minimum convex polygons of stable isotope ratios of winter fur sampled during the lemming peaks of 2007 and 2011. The isotopic signatures of winter fur reflect fox diets at the end of the preceding summer. Values in the upper right corner of the graph reflects diets of marine origin.
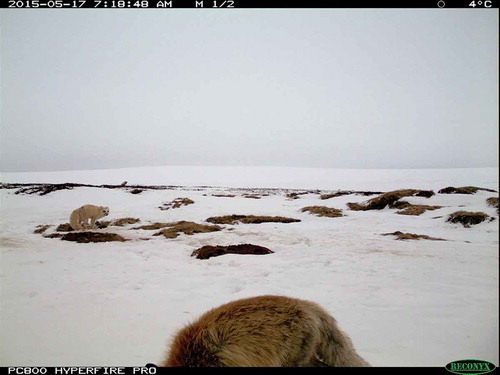
Figure 8. Photograph from a camera-trap at an Arctic fox den, 17 May 2015. A red fox is seen in the foreground, while an Arctic fox just outside a den entrance is seen in the background. An Arctic fox pair had been regularly present on this den until the appearance of the red fox seen in this photograph. No Arctic fox was recorded at this den after 18 May.