Figures & data
Figure 1. Circumpolar distribution of the Arctic fox (modified from Angerbjörn & Tannerfeldt Citation2014).
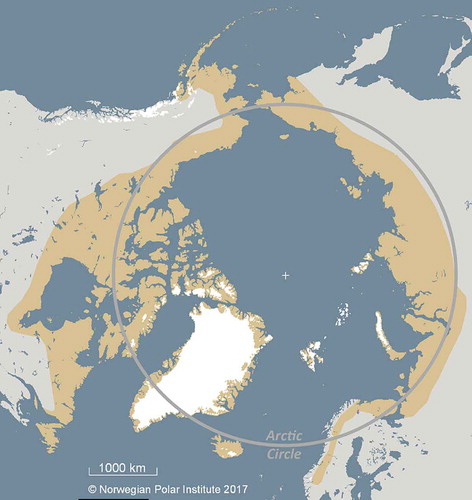
Figure 2. The two most common colour morphs (summer and winter pelage) of the Arctic fox and the three most common colour morphs of the red fox.
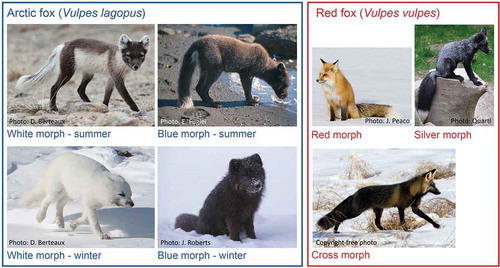
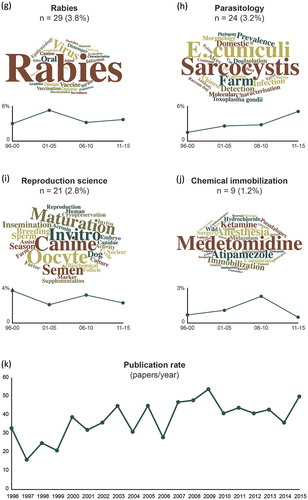
Figure 3. Bibliometric and network analysis of recent peer-reviewed literature dealing with the Arctic fox. We retrieved from Web of Science 755 articles published from 1996 to 2015. We first homogenized the format of the literature cited by these 755 articles, using the R package rscimap (available at https://github.com/ahasverus/rscimap), which we developed for our needs. We then built the matrix of similarity of the 755 publications by associating them with each other based on shared cited literature, using an association strength metric defined as AS = Number of shared citations(x,y) /(Number of citationsx × Number of citationsy), x and y representing each associated publication in a given pair. A high value of AS indicates that two publications cite very similar literature and therefore likely share a similar research topic, while a low value characterizes two publications addressing unrelated topics. Based on the obtained matrix of similarity, we used Version 0.9.1 of Gephi (Bastian et al. Citation2009) to perform a link-based modularity analysis and identify major clusters defined by a high similarity of literature cited. The topical focus of each cluster was identified through a word cloud analysis based on word frequency in article titles (geographic names were removed from the analysis). Title words were cleaned using the R package rscimap and word clouds were plotted using the R package wordcloud2 (Lang Citation2016). Word type size is proportional to title word frequency. Cluster titles were defined from the largest words in each word cloud and by reading the titles of papers belonging to each cluster. Graphs appearing under each word cloud indicate the proportion of publications in each cluster that were published in 1996–2000, 2001–05, 2006–2010 and 2011–15. The annual breakdown of the 755 publications is shown in Fig. 3k.
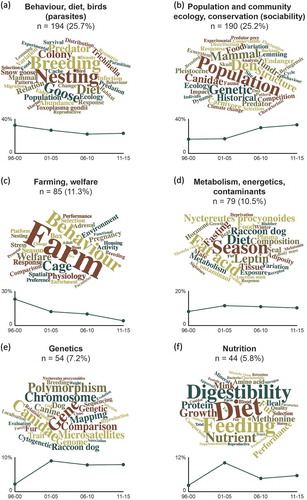
Figure 3. (continued).