Figures & data
Figure 1. The Hornsund region study area. Sections of an LOPC-CTD-F platform towed across the West Spitsbergen Shelf over seven summer seasons (July-August 2010–2016) are indicated by measuring points assigned to three zones. The shelf break (200 m isobath) is marked by a solid blue line. The bird icon indicates the location of the little auk colony in Hornsund.
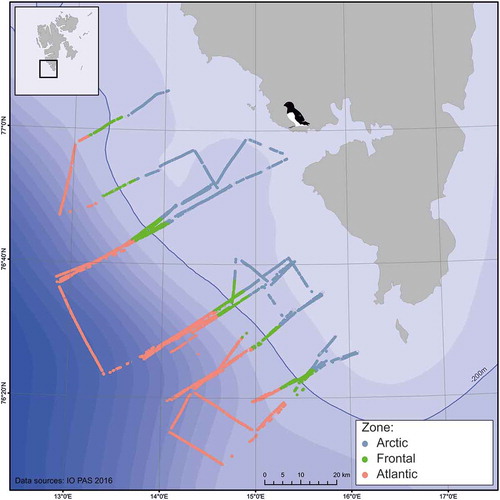
Figure 2. Mean depths of concentration of (a) small zooplankton, (b) large zooplankton and (c) chlorophyll fluorescence in the upper 50 m water layer over five summer seasons (2012–16) in three different zones of the West Spitsbergen Shelf area.
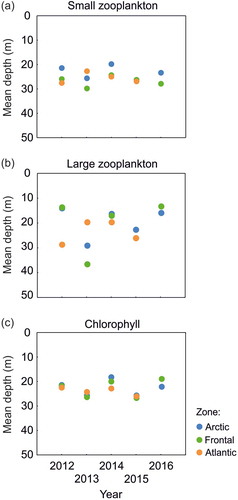
Figure 3. Distribution of the (a) seawater temperature, (b) chlorophyll fluorescence and (c) small zooplankton (ind. m−3) over seven summer seasons (2010–16) at 20–30-m depth layer along transect on the West Spitsbergen Shelf. Note the scale difference.
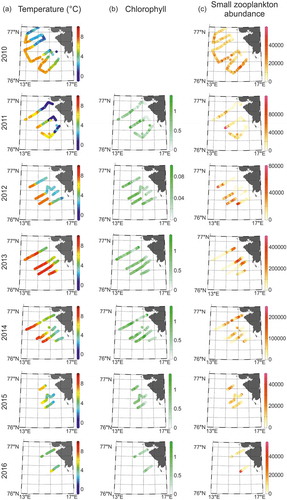
Table 1. Average abundance (ind. m−3) of the small size fraction over seven summer seasons (2010–16) in three zones (Arctic, Frontal and Atlantic) of the WSS at 20–30-m depth.
Table 2. Average abundance (ind. m−3) of the small size fraction (small) and the Calanus size fraction (large) over five summer seasons (2012–16) in three zones (Arctic, Frontal and Atlantic) of the WSS in the upper 50 m layer.
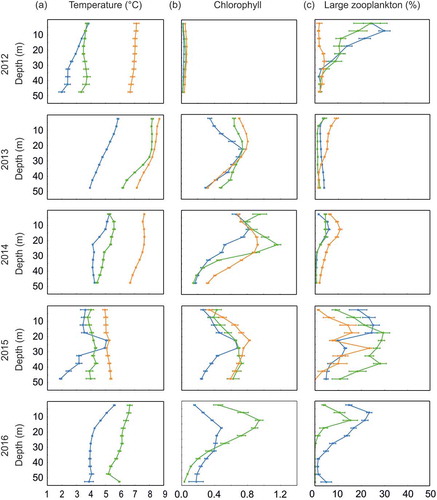
Figure 4. Vertical profiles of the mean and 95% CI of the (a) water temperature, (b) chlorophyll fluorescence and (c) percentage of large zooplankton in total plankton abundance the upper 50 m water layer over five summer seasons (2012–16) in three different zones (Arctic Zone marked in blue, Frontal Zone marked in green and Atlantic Zone marked in orange).