Figures & data
Figure 1. The location of Bharati, the Indian research station, in Antarctica.
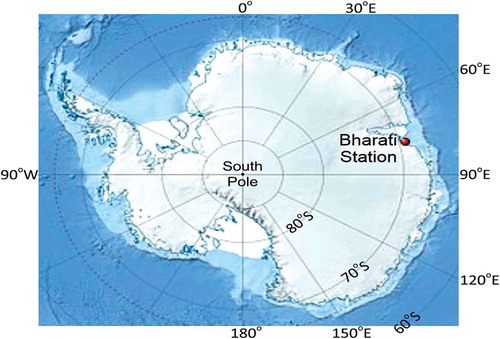
Table 1. Details of the data used and their sources. The period was 22 January–25 February 2016.
Figure 2. Daily variation of atmospheric CO2 with meteorological parameters (a) AT (°C), (b) RH (%), (c) WS (m s−1) and (d) surface pressure (hPa).
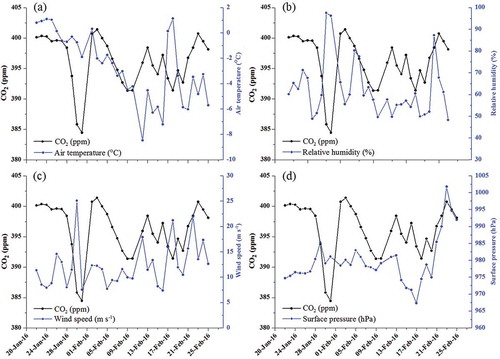
Figure 3. Box and whisker plots of atmospheric CO2 with meteorological parameters (a) AT (°C), (b) RH (%), (c) WS (m s−1) and (d) wind direction (deg.). The lower and upper whiskers shows 5th and 95th percentiles of the data. The lower and upper quartiles of the vertical boxes represent the 25th and 75th percentiles, respectively – together they comprise the middle 50% of the data. The horizontal line in each vertical box indicates the median of the data. Values which are beyond whiskers are outliers. Lowest and highest CO2 values are represented at the 5th and 95th percentiles of the data. (e) Frequency distribution of WS and mean CO2. (f) Precipitation influence on daily mean CO2.
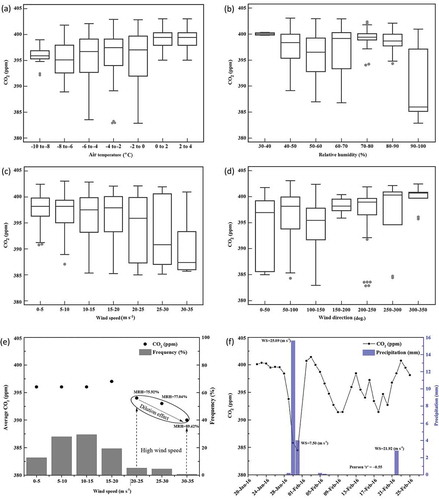
Table 2. Statistical correlation between CO2 and its influencing parameters at Bharati Station.
Figure 4. Correlation of CO2 with different meteorological parameters at Bharati station, during summer 2016.
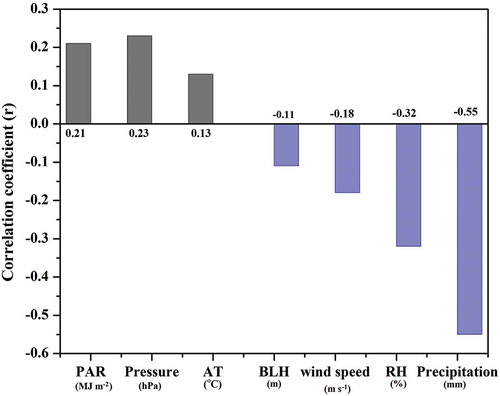
Table 3. Training and results of the least squares multiple regression analysis performed between meteorological parameters and the CO2 mixing ratio (the dependent variable).
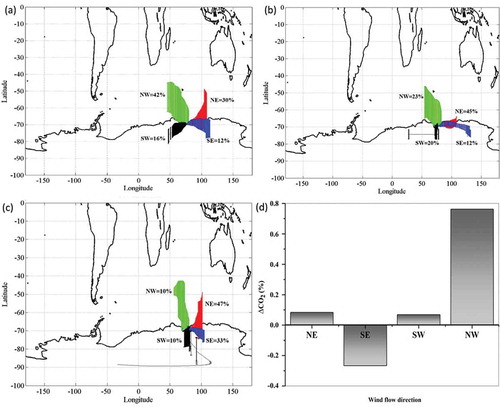
Figure 5. Long range air-mass trajectories to Bharati at altitudes (a) 3 km, (b) 2 km, (c) 1 km altitude and (d) change in CO2 (%) in different wind sectors.