Figures & data
Table 1. Prey remains found in the scats of (a) Antarctic (Arctocephalus gazella) and (b) Subantarctic (A. tropicalis) fur seals, collected at Marion Island from April 2006 to March 2010. The most important prey, nominally identified as those with %N > 10.0, are shown in boldface.
Figure 1. Histograms showing the number of (a) Antarctic and (b) Subantarctic fur seal scats collected at Marion Island from April 2006 to March 2010. For seasonal analyses, scats were pooled into ‘summer’ months (grey shaded blocks) (386 and 504 scats for Antarctic and Subantarctic fur seals, respectively) and ‘winter’ months (275 and 246 scats for Antarctic and Subantarctic fur seals, respectively).
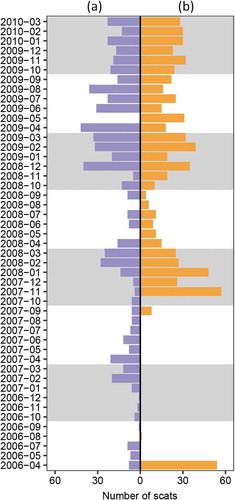
Figure 2. Numerical abundance (%) of prey in the scats of (a, c) Antarctic and (b, d) Subantarctic fur seals during (a, b) summer and (c, d) winter at Marion Island. Sample sizes shown represent all prey items for each species and period, but only the 10 most abundant prey are shown (which corresponds approximately with prey contributing %N > 1). They are ordered by overall %N rank (see for specific values). Error bars depict 95% confidence intervals.
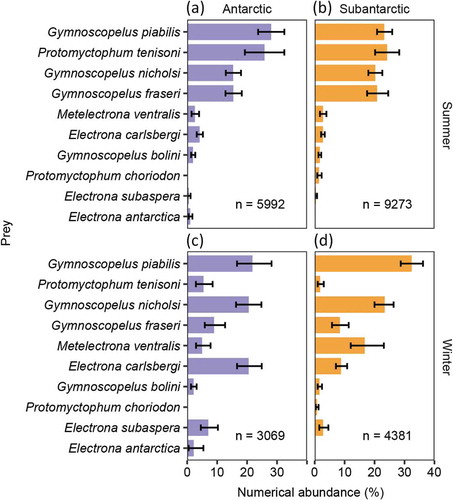
Figure 3. Changes in the summer diet composition (numerical abundance) of (a) Antarctic fur seals and (b) Subantarctic fur seals over four summers at Marion Island. For display, the four most abundant prey are labelled and they are ordered by summer %N rank (see ). For Subantarctic fur seals, summer data were not collected in 2006/07. Linear regressions of the changes are shown in Supplementary Table S2.
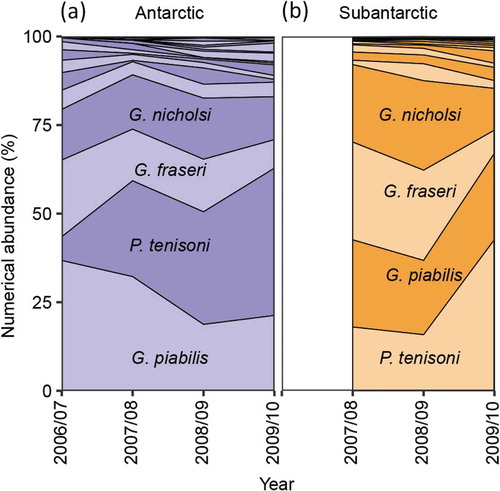
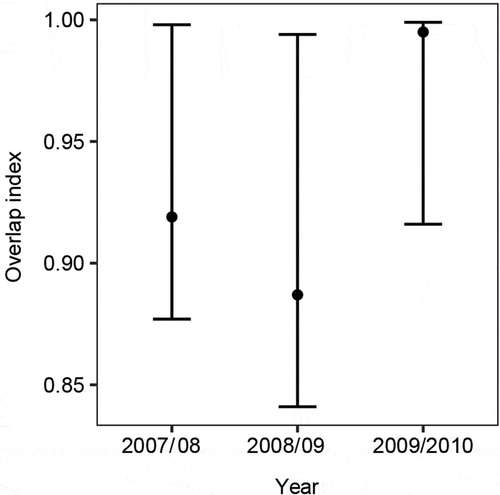
Figure 4. Diet overlap (Pianka’s index) between Antarctic and Subantarctic fur seals over three summers at Marion Island. Error bars indicate 95% confidence intervals.