
Figures & data
Figure 1. The study area: (a) the location of Hornsund (black square) and the main current system west of Svalbard and CTD stations along Section N (yellow dots); (b) the area used to calculate SIC; (c) the fjord’s Outer Part, Main Basin and Brepollen. The blue line separating the Outer Part and Main Basin represents the mouth of the fjord. The red line between the Main Basin and the Brepollen indicates the location of the sill. The positions of the CTD stations in Hornsund are marked with yellow dots. Filled black squares show mooring location and red dot shows the location of the Polish Polar Station (PPS), which has a meteorological station.
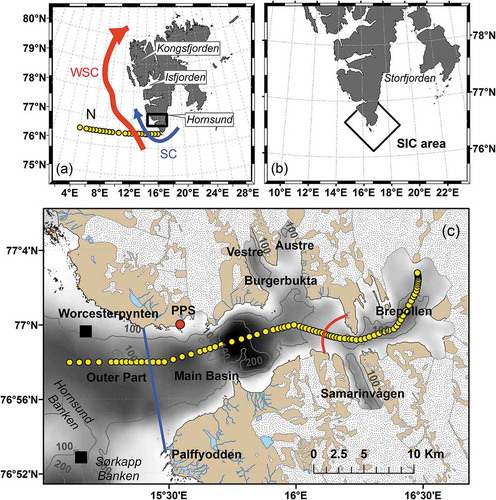
Figure 2. Distribution of temperature and salinity along the CTD section in Hornsund in July each year (2001–2015). There are no data for 2004 and 2005. The left side of each panel corresponds to the Outer Part of the fjord; the right side is Brepollen, the innermost part of the fjord.
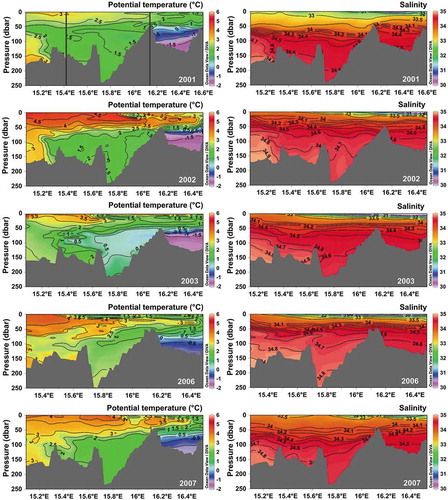
Figure 2. Continued.
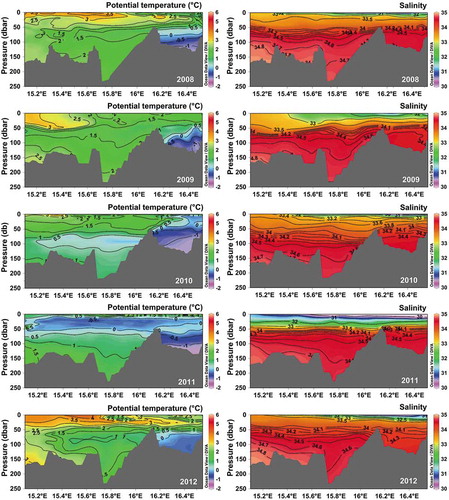
Table 1. Detailed information on mooring location and duration.
Table 2. Water mass classification for Hornsund (adopted from Nilsen et al. Citation2008). Values for ArW are taken from the observations at the shelf outside Hornsund.
Figure 3. Potential temperature versus salinity diagrams for data collected in July (2001–2015). There are no data for 2004 and 2005. Data from the Outer Part are shown in red, the Main Basin in green, and Brepollen in blue.
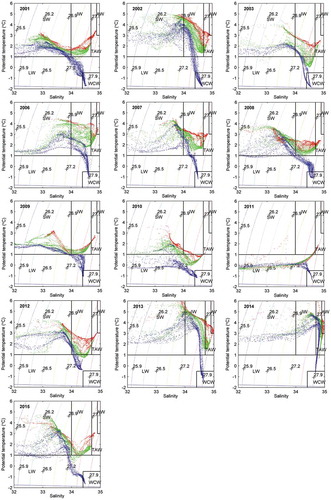
Figure 4. Distribution of water masses along the CTD section for July 2001 to July 2015. There are no data for 2004 and 2005. The red line around the border of the SW is an artefact and should not be mistaken for the AW. The black lines in the upper left panel show where the three areas have been divided for analytical purposes: from left to right, the Outer Part, Main Basin and Brepollen (innermost part of the fjord).
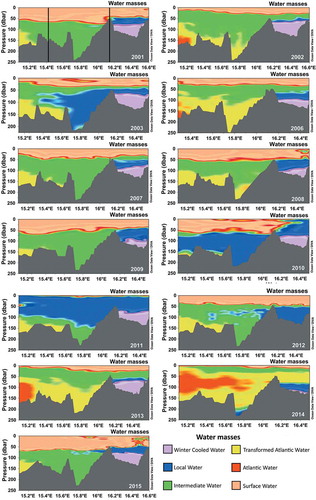
Figure 5. (a) Daily mean temperature, (b) salinity and (c) density from moored Microcat for July 2010- July 2011 at 24 m (dashed line), July 2011–July 2012 at 46 m (solid line), and August 2012–July 2013 at 85 m (bold line). The most pronounced water masses during different periods are indicated at the top (see for explanation of the abbreviations).
Figure 6. Mean temperature and salinity in (a) the Main Basin and (b) below 100 m in Hornsund and (f) WCW area and temperature in July compared to potential influencing factors: (c) AW temperature and salinity; (d) yearly mean SIC (solid line) and (d) SIC in July (dots); and (e) winter (December–February) air temperature and DFI.
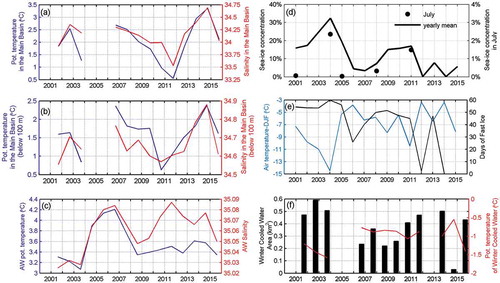
Table 3. Summary of linear regression. Only statistically significant (p < 0.05) results are shown.