Figures & data
Figure 1. (a) The CS700H, seen here with the SR50 snow depth sensor (on the left on the horizontal rod), undergoes a test at a site at the University of Malaya before deployed to Rothera. (b) The wind shield installed around the UPG-1000 (inset). (c) A VPF-730 sensor. (d) PWS-100 installed at Rothera Station. (e) An LPM installed at Rothera.
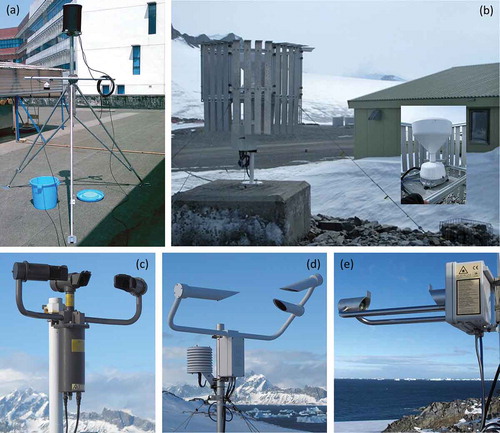
Figure 2. Location of Rothera Station (67° 34’S, 68° 08ʹW). (Modified from a map by Kikos, CC BY-SA 3.0, https://creativecommons.org/licenses/by-sa/3.0, from Wikimedia Commons.)
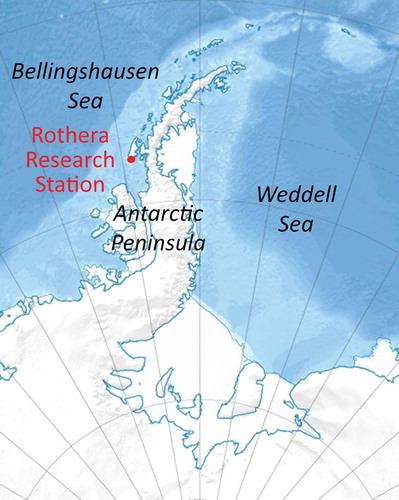
Table 1. Number of precipitation days measured by each instrument (UPG-1000, PWS-100, VPF-730, LPM, CS700H), reanalysis data sets (ERA-Int, JRA-55), CFSv2 model and the GPCP during the study period (19 March 2015 to 4 February 2016). Note: The GPCP data were available up to 31 October 2015 at the time of writing.
Figure 3. Monthly precipitation for all the precipitation instruments, reanalyses, model and the GPCP 1DD.
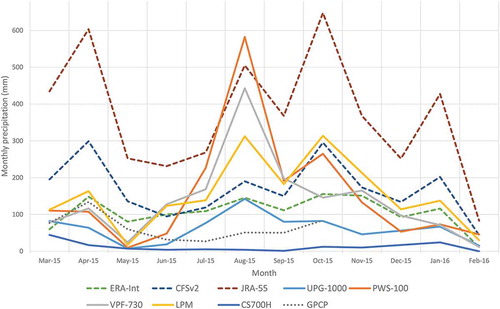
Table 2. Correlation table for the precipitation measured by the precipitation instruments (UPG-1000, PWS-100, VPF-730, LPM, CS700H), reanalysis data sets (ERA-Int, JRA-55), CFSv2 model and GPCP. Numbers in boldface are values that are significant α = 95% (p ≤ 0.05).
Table 3. Mean and standard deviation of precipitation for autumn, winter, spring and summer.
Figure 4. Seasonal precipitation for the precipitation instruments, reanalysis data sets and model.
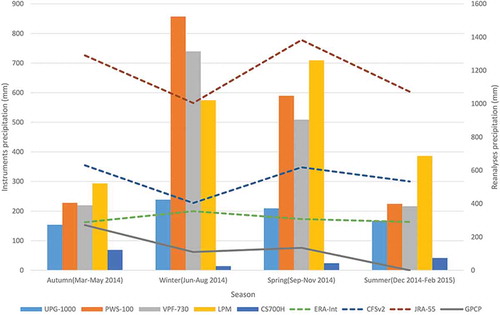
Figure 5. (a) Daily temperature, (b) mean wind speed and (c) daily precipitation at Rothera 19 March 2015 to 6 April 2015. The wind and temperature data were obtained via automated sensors connected to a CR1000 datalogger at Rothera.
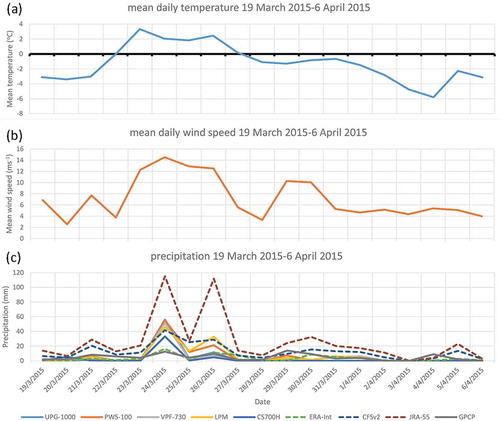
Figure 6. (a) Daily temperature, (b) mean wind speed and (c) daily precipitation at Rothera 27 July 2015 to 18 August 2015. The wind and temperature data were obtained via automated sensors connected to a CR1000 datalogger at Rothera.
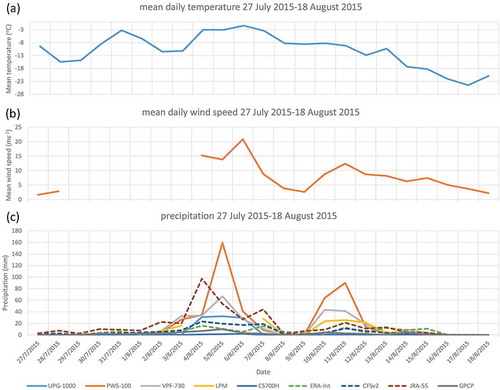
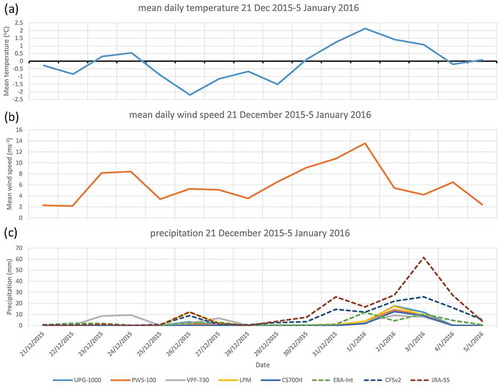
Figure 7. (a) Daily temperature, (b) mean wind speed and (c) daily precipitation at Rothera 21 December 2015 to 5 January 2016. The wind and temperature data were obtained via automated sensors connected to a CR1000 data logger at Rothera.