Figures & data
Figure 1. Flowchart of the study population.
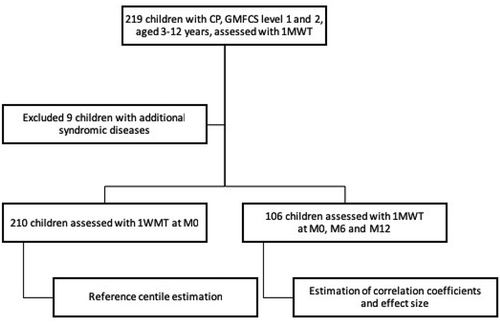
Table 2. Tabulated 1MWT reference centiles for use with children having cerebral palsy (GMFCS 1 and 2), including the LMS values.
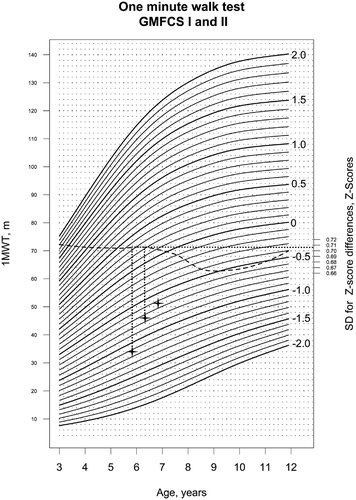
Figure 2. Reference curves for 1MWT in children with CP GMFCS level 1 and 2. The centiles are labeled with the corresponding Z‐scores. The dashed line represents the standard deviation of the difference of two GMFM-66-Z-scores measured 6 months apart.
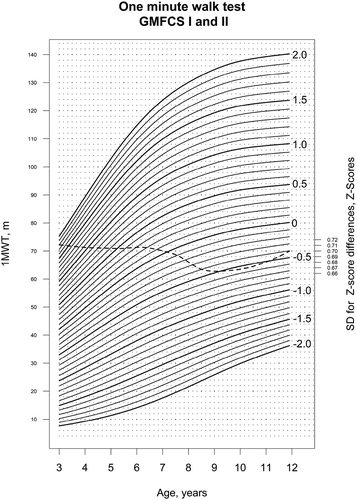
Table 1. Characteristics of the study population and evaluation of the effect of the rehabilitation program on the walking capacity assessed by the 1MWT.
Table 3. Tabulated values of the standard deviation of 1MWT Z-score differences (6 months apart).
Figure 3. Case study. The figure illustrates the use of the reference centiles. First, the two 1MWT scores are entered (three crosses, 34 m at M0, age1 = 5 years 11 months, 46 m at M6, age2 = 6 years 5 months, and 51 m at M12, age3 = 6 years 11 months). The corresponding Z-scores are Z1 = −1.146 for M0, Z2 = −0.773 for M6 and Z3 = −0.652 for M12. The age-dependant standard deviation (SD1) of the centile change, is determined by using the dashed curve and the age of the child at the first 1MWT assessment at M0 (SD1 = 0.761) and at M6 (SD2 = 0.758). Using the formula (Z2-Z1)/SD1, the Z-score for the centile change can be calculated. It corresponds to an effect size (−0.773 + 1.146)/0.761 = 0.49 for the first 6 months, during the active training in the rehabilitation program ‘Auf die Beine’. During the observational 6-month period (Z3-Z2)/SD2 = 0.16 corresponding to a negligible effect size.