
Figures & data
Table 1. Overview of EGCC interventions in the study
Table 2. Data collection at each timepoint (T1–T4)
Table 3. Participant characteristics
Table 4. Analysis of PIADS and communication matrix
Figure 1. Total computer use (activities, frequency and duration) at each time point (T1 n=17; T2 n=17; T3 n=16; T4 n=17). Duration: one participant at T1 (270 min), and another at T2 and T3 (T2: 249 min; T3: 323 min) with extreme values in duration are not shown in the boxplot
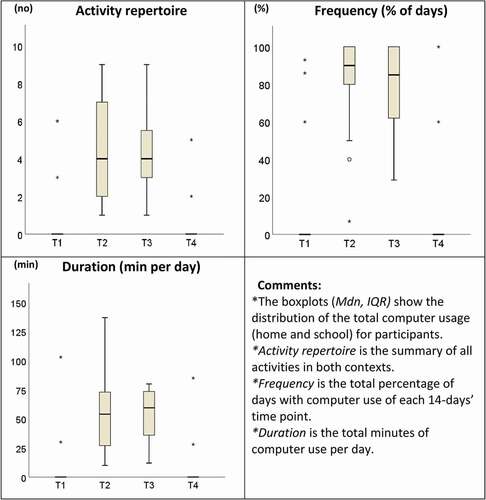
Table 5. Frequencies (%) of EGCC use in school and at home and activities performed, both predefined and own added. Numbers presented as median values (range)