
Figures & data
Table 1. Participant Characteristics
Table 2. IMP question ceiling item at <6, 9 and 12 months of age
Figure 1. Mean question ceiling score from the Infant Monitor of vocal Production at 6, 9 and 12 months of age for infants at risk of cerebral palsy (CP) and typically developing (TD) infants (with 95% CI).
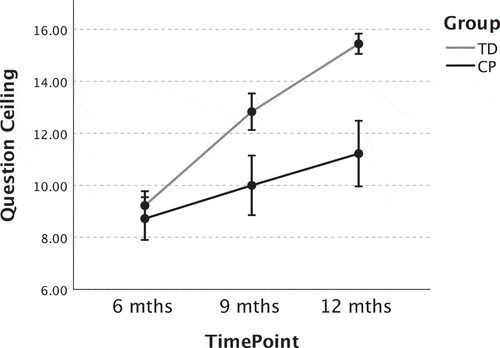
Figure 2. Mean percentage rank score from the Infant Monitor of vocal Production at 6, 9 and 12 months of age for infants at risk of cerebral palsy (CP) and typically developing (TD) infants (with 95% CI).
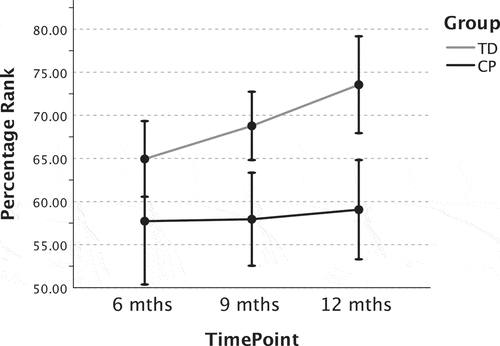
Table 3. Factor Loadings for Extracted Dimensions from the Principle Components Analysis of IMP Item Scores at 9 Months of Age (N = 36)
Table 4. Factor Loadings for Extracted Dimensions from the Principle Components Analysis of IMP Item Scores at 12 Months of Age (N = 36)
Table 5. Receptive-Expressive Emergent Language Test Score (REEL-3) for all Participants Across Three Testing Occasions
Figure 3. Mean language ability score from the REEL-3 at 6, 9 and 12 months of age for infants at risk of cerebral palsy (CP) and typically developing (TD) infants (with 95% CI).
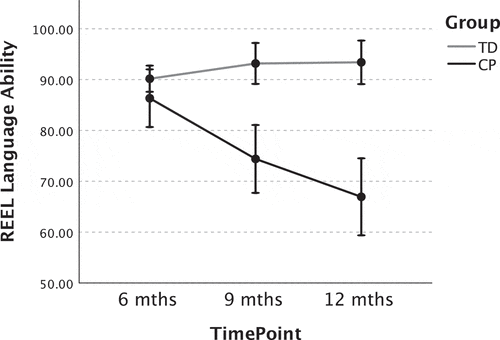
Figure 4. Mean REEL-3 expressive and receptive raw scores at each time point for infants diagnosed at 24 months with spastic (n = 6) and dyskinetic (n = 9) cerebral palsy (error bars are ± 1 SD).
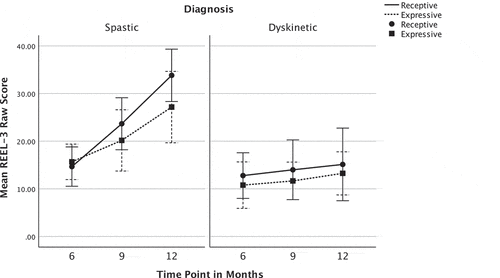
Table 6. Cross Tabulation Showing the Number of Children At-risk of Cerebral Palsy Below and Within Normal Limits on the REEL-3 Language Ability Standard Score and IMP Total Ceiling Score at 9 and 12 Months of Age