Figures & data
Figure 1. Process mediation analysis: How dark triad leaders influence the coach and coaching.
Note. Standard regression coefficients with the standard errors in the brackets are depicted with significant pathways being highlighted by thick arrow lines and the significance level (***p < .001; **p < .01; *p < .05). Non-significant pathways and independent variables are shown with dotted (arrow) lines. Direct effect: t(63) = 0.47, p = .642; total effect: t(63) = −0.24, p = .808; effect of leadership level on the perceived client’s dark triad score: t(63) = 2.62, p = .011.
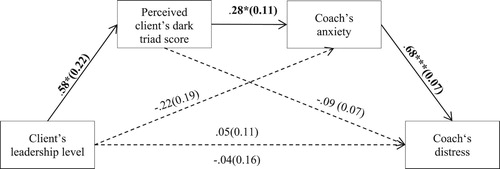
Figure 2. Process mediation analysis: How dark triad leaders influence the coach and coaching.
Note. Standard regression coefficients with the standard errors in the brackets are depicted with significant pathways being highlighted by thick arrow lines and the significance level (***p < .001; ** p < .01; *p < .05). Non-significant pathways and independent variables are shown with dotted (arrow) lines. Direct effect: t(63) = −1.23, p = .206; total effect: t(63) = −1.33, p = .187; effect of leadership level on the perceived client’s dark triad score: t(63) = 2.62, p = .011.
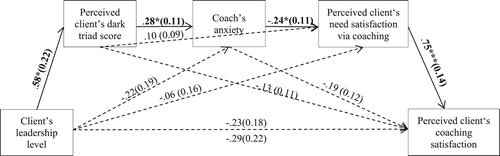
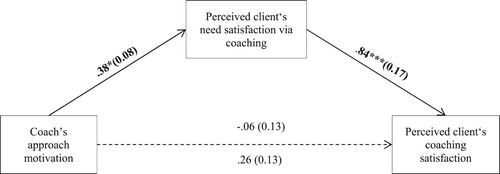
Figure 3. Process mediation analysis: How the coach’s approach motivation influences coaching.
Note. Standard regression coefficients with the standard errors in the brackets are depicted with significant pathways being highlighted by thick arrow lines and the significance level (***p < .001; ** p < .01; * p < .05). Non-significant pathways and independent variables are shown with dotted (arrow) lines. Direct effect: t(63) = −1.23, p = .206; total effect: t(63) = 1.96, p = .054.