Figures & data
Table 1. Codebook measures – conceptual understanding.
Table 2. Codebook measures – careers.
Table 3. Codebook measures – think, feel, do.
Table 4. Codebook measures: ocean conservation intentions and behaviors.
Table 5. Undergraduate student survey measures.
Table 6. Elementary school teacher survey measures.
Figure 1. Scales related to .
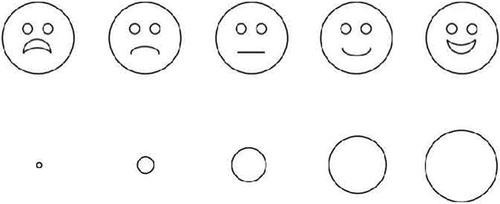
Figure 2. Percent of children’s drawings scored for three measures of content centricity before (pre) and after (post) attending SVF for students in kindergarten (N = 10), second grade (N = 24), and fourth grade (N = 15).
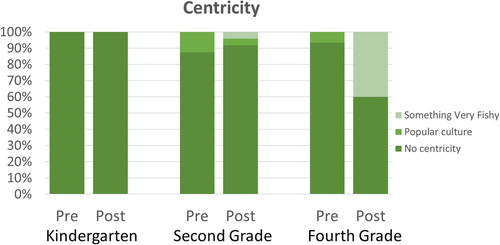
Figure 3. Percent of children’s drawings scored for four measures of content construct before (pre) and after (post) attending SVF for students in kindergarten (N = 10), second grade (N = 24), and fourth grade (N = 15).
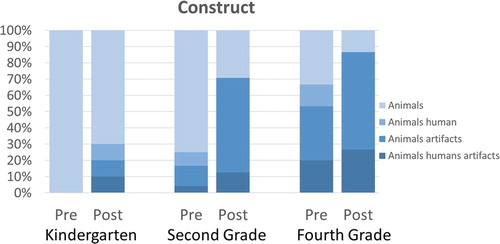
Figure 4. Percent of children’s drawings scored for three measures of content color before (pre) and after (post) attending SVF for students in kindergarten (N = 10), second grade (N = 24), and fourth grade (N = 15).
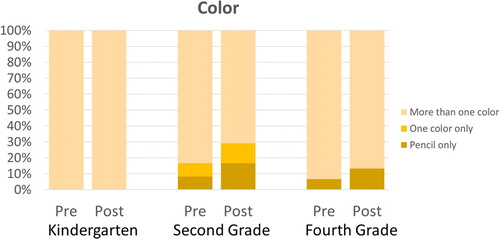
Figure 5. Percent of children’s drawings scored for two measures of content scenario before (pre) and after (post) attending SVF for students in kindergarten (N = 10), second grade (N = 24), and fourth grade (N = 15).
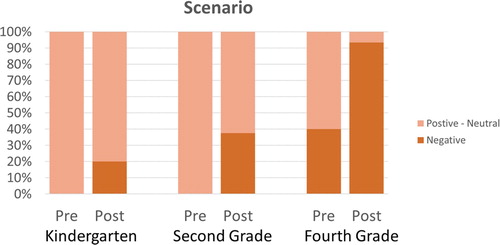
Table 7. Linear regressions for undergraduates addressing RQ1 and RQ2.
Table 8. Linear regressions for elementary school teachers addressing RQ3, RQ4 and RQ5.
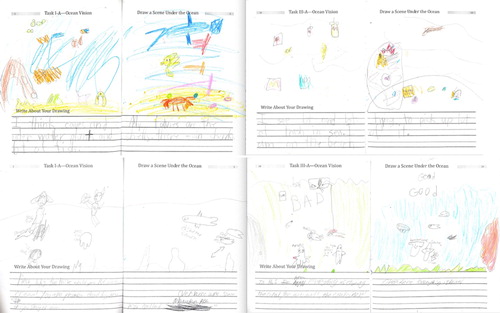
Figure A1. Pre and post drawings of student A (top) and student B (down).