
Figures & data
Figure 1. Loop Trail Quest experimental design model. The figure shows how each treatment incorporates elements of Prensky’s framework. The shaded boxes represent additional steps that we added to reflect social marketing principles to reveal value-based “reasons why” visitors do what they do in order of priority, and to assess any changes in “ethic” from their original goal orientation.
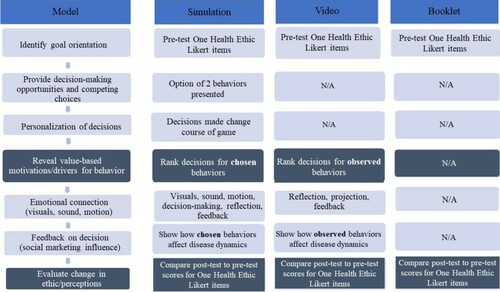
Figure 2. Study Sites of Great Falls, Maryland, USA.
Note: Stars indicate study points. NPS, Citationn.d.
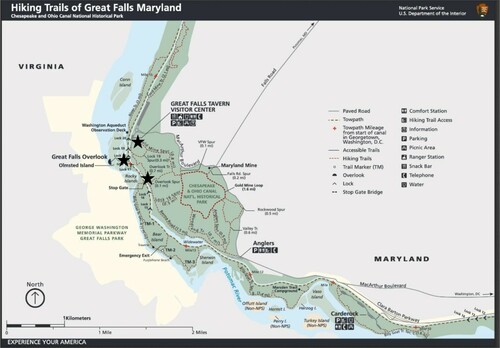
Figure 3. View of Great Falls from Olmstead lookout, Maryland, USA. 2019.

Figure 4. Simulation flow and decision points for Loop Trail Quest simulation.
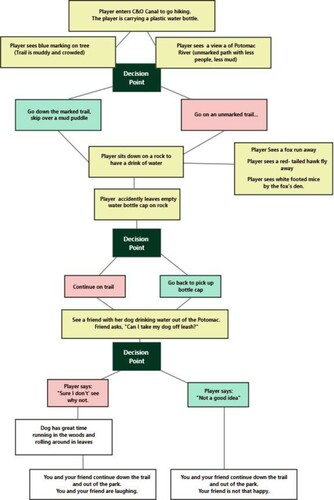
Figure 5. A George Mason University researcher engaging participants. Photo: Susan Howard, 2019.
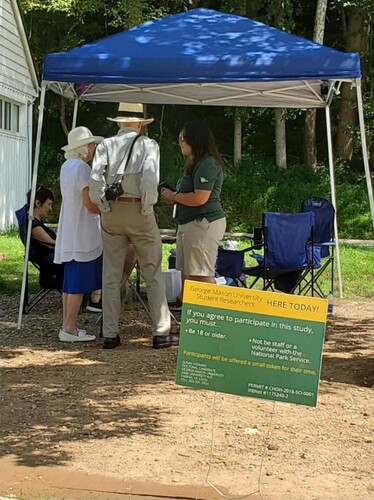
Figure 6. Likert item questions from pre- and post-tests during Loop Trail Quest study.
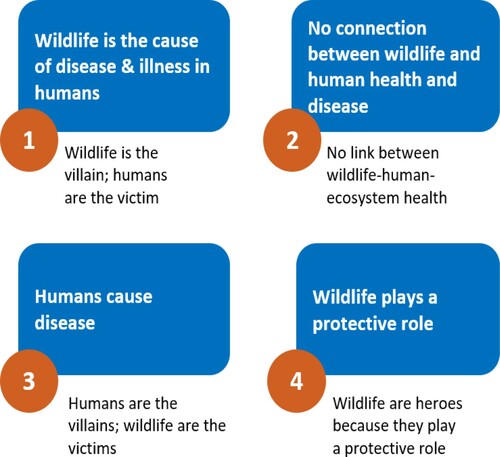
Table 1. Median scores for Likert test in Booklet, Video, and Simulation treatments.
Figure 7. Histograms showing the distribution of changes in score from Likert pre-post-tests.
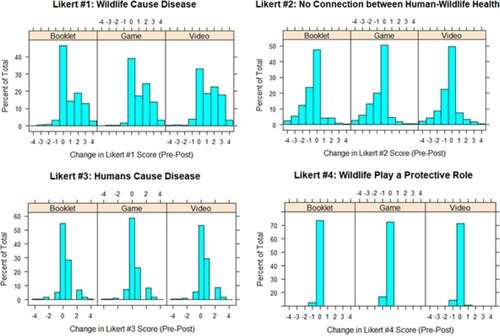
Table 2. Significant results of Dunn’s test comparing demographics and test mode by change in Likert score.
Table 3: Best fitting models produced by Ordinal Logistic Regression and Stepwise Regression showing variables that predict the outcome variable of “change in Likert score”
Table 4. Most commonly ranked options for Video treatment. Options ranked as 1st, 2nd, or 3rd choice.
Table 5. Results of Chi Square test: demographics associated with choice-ordering for Video treatment.
Table 6. Most commonly ranked options for Simulation treatment. Options ranked as 1st, 2nd, or 3rd choice.
Table 7. Results of Chi Square test: demographics associated with choice-ordering for Simulation treatment.
Supplementary Material
Download MS Excel (213.5 KB)Data availability statement
The data that support the findings of this study are openly available in Zenodo at https://zenodo.org/badge/latestdoi/283313029, reference number 10.5281/zenodo.3964833.