
Figures & data
Table 1. Summary of Proposed Hypotheses.
Figure 1. Interactive Scenarios Presented in the VR Game.
Note: From left to right, the screenshots correspond to the dining scene, grocery shopping scene, and recycling scene.
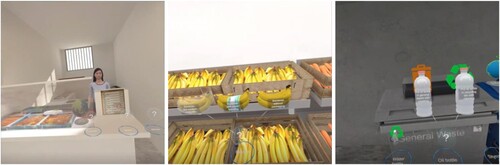
Figure 2. Underwater Environments for Participants with Low Scores (Left), Medium Scores (Middle), and High Scores (Right).
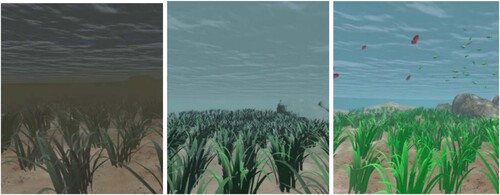
Table 2. Zero Order Correlations.
Figure 3. Serial Mediation Model with Perceived Autonomy and Autonomous Motivation as Mediators.
Note: *p < .05, **p < .01, ***p < .001.
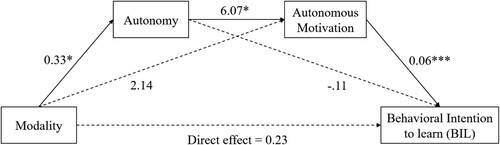
Table 3. Mediation Results for the Relationship between Modality and BIL.
Table 4. Mediation Results for the Relationship between Modality and BICD.
Supplemental material
Supplemental Material
Download PDF (446.9 KB)Data availability statement
Data will be made available on request.