Figures & data
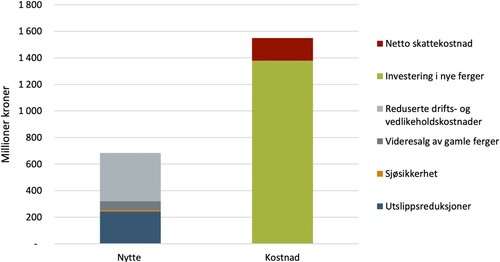
Figure 1. Excerpt from Climate Cure 2020 sub-report ‘Assessment of Future Carbon Prices’ (Norwegian Pollution Control Authority 2009). The table is titled ‘Future carbon prices.’ It presents the expected future carbon price in the carbon market for the years 2012, 2015 and 2020 in three scenarios called ‘Low’ (Lav), ‘Medium’ (Middels), and ‘High,’ (Høy) (translated from Norwegian).
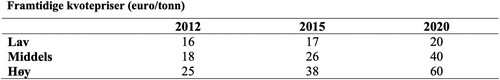
Figure 2. Excerpt from the Norwegian Public Roads Administration's manual, Table 5–39 (Norwegian Public Roads Administration Citation2018). The step table presents monetary values on the left under the heading ‘Norwegian Krone/tonne CO2-equivalent’ for the years 2015, 2020 and 2030 on the right under the heading ‘Year’ (translated from Norwegian).
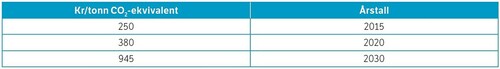
Figure 3. 3 Excerpt from the cost-benefit report (Menon Citation2017). This is a bar chart with the title ‘Measure B: Phase-out by 2032’. ‘Benefits’ (Nytte) are represented by the left bar, and ‘Costs’ (Kostnad) are represented by the right bar. Listed on the right, are the investment costs ‘Net tax cost’ (Netto skattekostnad) and ‘Investment in new ferries’ (Investering i nye ferger), and the social benefits ‘Reduced operational costs and maintenance cost’ (Reduserte drifts- og vedlikeholdskostnader), ‘Resale of old ferries’ (Videresalg av gamle ferger), ‘Water safety’ (Sjøsikkerhet) and ‘Emission reductions’ (Utslippsreduksjoner) (translated from Norwegian).