Figures & data
Figure 1. Cotton cloth imports per capita into East and West Africa, 1848–1946. Sources: Pre-colonial figures (1840–1899): US shipping records: MSS901, David Pingree Papers, Phillips Library, Peabody Essex Museum, Salem (PEM); MSS24, Emmerton Family Papers, PEM; MH23, Michael Shepard Papers, PEM; MH235, West Family Papers, PEM; Arrival and Departure of American Vessels, Jan 1, 1857 to June 29, 1894, Record Group 84, Records of Foreign Service Posts, Zanzibar, Vol. 84, The National Archives, College Park; Bombay annual trade data, 1848–1901: Report of the Commerce of Bombay; Annual Statement of the Trade and Navigation of the Presidency of Bombay; Jenkins, Report on the External Commerce; UK annual trade data, 1857–1901: Annual Statement of the Trade of the United Kingdom; Secretary of State, “Zanzibar,” 33; Pratt, “Zanzibar,” 841; Cave, Zanzibar, 5; colonial figures (1897–1946): British Central Africa/Nyasaland Blue Books, 1902–1938, Colonial Office (CO) 452/6–42, The National Archives, London (TNA); Tanganyika Blue Books, 1920–1946, CO 726/1–30, TNA; Uganda Blue Books, 1905–1916, CO 543/1–36, TNA; Statistical Abstracts for the Several British Oversea Dominions and Protectorates, 1909–1923, 1924–1933 and 1929–1938, The Hague, Central Bureau of Statistics (CBS); Bureau of Manufacturers, “German East Africa,” 776; Department of Commerce, “German East Africa,” 177; population data: Frankema–Jerven African Population Database 1850–1960, version 1.0.
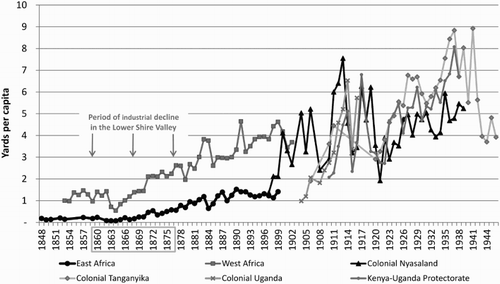
Figure 2. Terms of trade for oilseeds, 1846–1910 (1902 = 100). Sources: Global oilseed prices: Sauerbeck “Prices” series, 1886–1917; cloth prices on the East African coast: Sheriff, Zanzibar, 253–6; MH23, MH235, MSS901, and MSS24 series (PEM); Statistical Abstract for the Several British Colonies, Possessions, and Protectorates in Each Year from 1891 to 1905, 110–11 (CBS); Statistical Abstracts for the Several British Oversea Dominions and Protectorates in Each Year from 1909 to 1923, 163–4 (CBS).
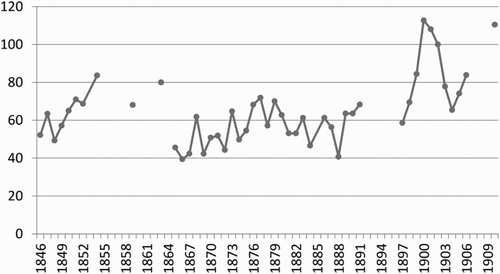
Figure 3. Oilseed price index, 1846–1910 (1902 = 100). Source: Sauerbeck “Prices” series, 1886–1917.
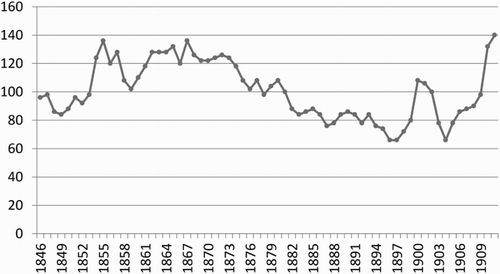
Figure 4. Villager-grown sesame oilseed and lint cotton exports, 1897–1939. Sources: Sesame oilseed exports: British Central Africa/Nyasaland Blue Books (TNA); villager-grown lint cotton exports: Mandala, Work, 37 (Table 4.1).
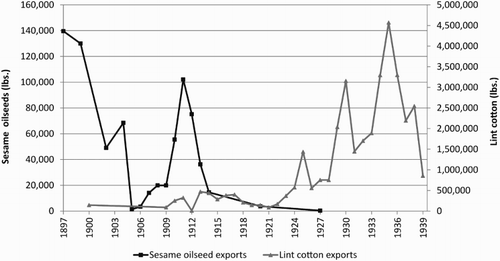
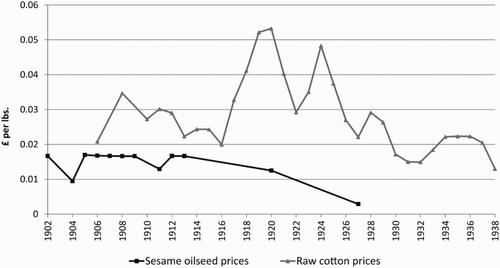
Figure 5. Unit prices of sesame oilseeds and raw cotton, 1902–1938. Sources: British Central Africa/Nyasaland Blue Books, 1902–1938, TNA.