Figures & data
Table 1. ESC data of sugarcane plantation and inclusive development packages.
Figure 1. Historical sugar prices in $US. Source: Macrotrends, Sugar prices historical chart data.
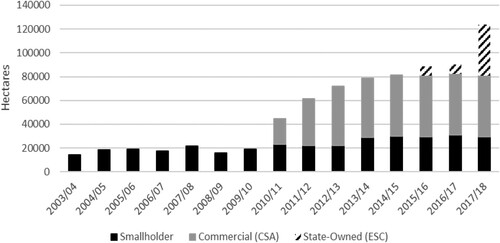
Figure 2. Total hectares earmarked for sugar cane plantation. Source: Central Statistics Agency (CSA) for commercial data; ESC reports for state-run projects.
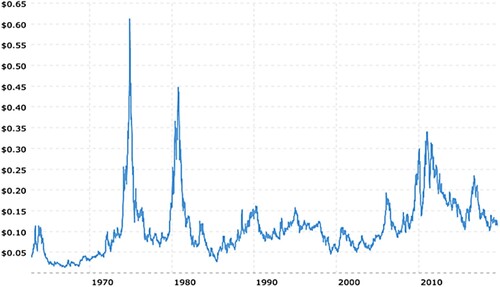
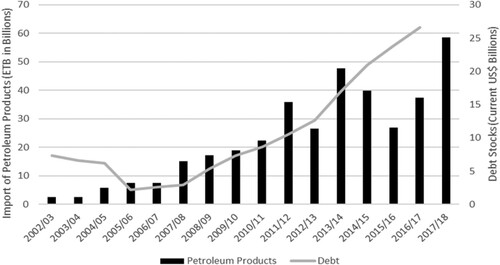
Figure 3. Import of petroleum products and the rise in Ethiopia’s national debt. Source: NBE, Annual report of 2015/16, 2016/17 and 2017/18; World Bank, Data Bank – Ethiopia.