
Figures & data
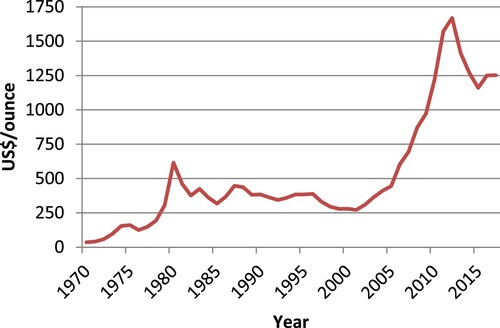
Figure 1. International gold price, 1970–2017 Source: Authors’ compilation of www.kitco.com data
Map 1. Surveyed mineral sites Source: drawn by Michael Shand.
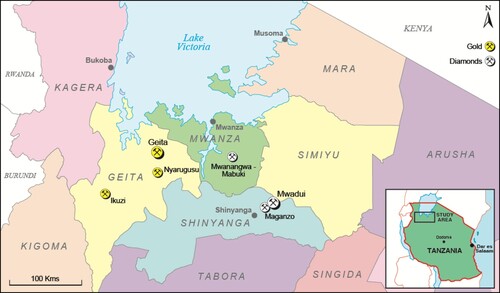
Table 1. Settlement study sites in northwest Tanzania.
Figure 2. Artisanal mining settlement trajectory. Source: drawn by Deborah Bryceson.
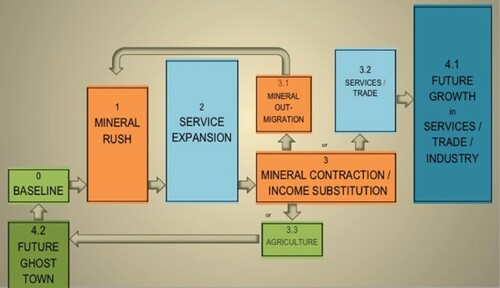
Figure 3. Spatial and temporal interaction between artisanal and large-scale mining. Source: drawn by Deborah Bryceson.
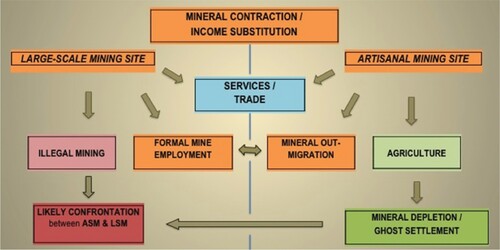
Table 2. Migration and settlement patterns in overall study.
Figure 4. Settlements’ welfare status by wealth quintiles/settlement/mineral type* (% of settlement population) Source: UPIMA survey data, 2012 * Note: gold settlements (red), diamond settlements (blue)
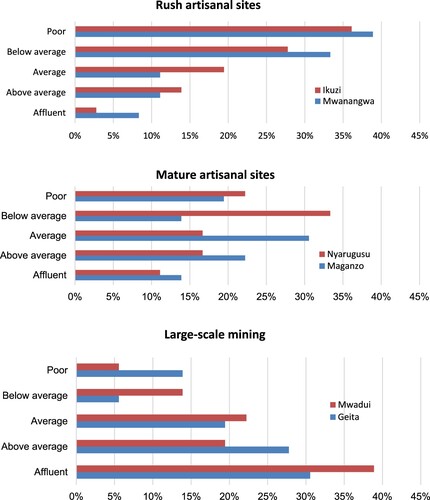
Figure 5. Household heads’ by main occupation & welfare quintile* (% household heads) Source: UPIMA survey data, 2012.
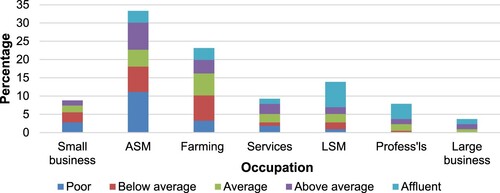
Table 3. Household heads by welfare quintile and socio-economic characteristics.
Figure 6. Household heads’ education level by settlement typ. Source: UPIMA survey data, 2012.
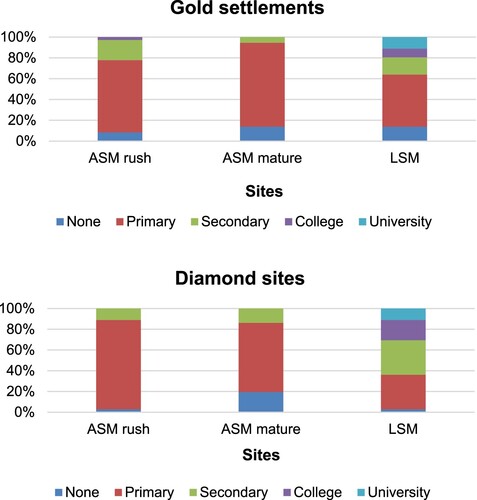
Figure 7. Household heads’ education level by welfare quintiles Source: UPIMA survey data, 2012.
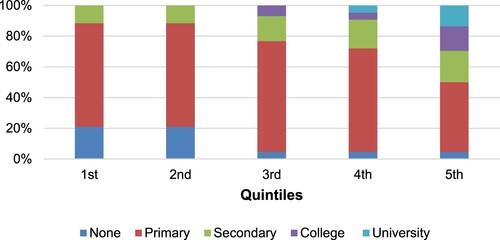
Table 4. Household labour patterns, housing, consumption and investments by welfare quintile.