Figures & data
Table 1. Description of urban regions (ESPON Citation2007) and number/average area of LAU2 units in the analysis.
Figure 1. Porto, Bristol and Antwerp urban regions, as defined by ESPON (Citation2007). Dark colour: morphological urban regions (MUAs); light colour: functional urban region (FUA).
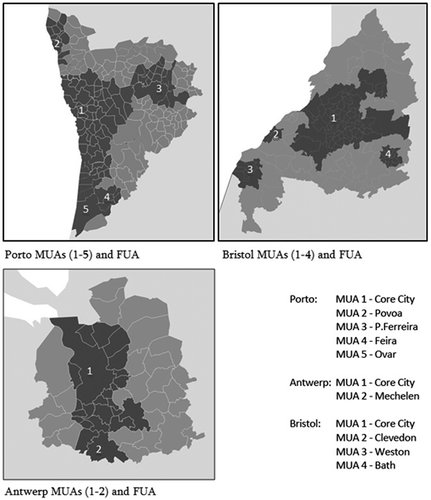
Figure 2. Rank-size population distribution per LAU2 unit in Porto, Antwerp and Bristol, 1890–2011.
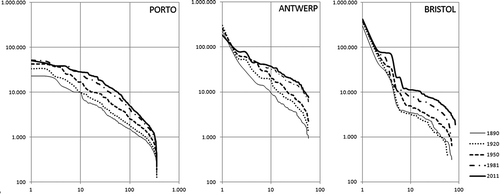
Figure 3. (a) Population density variation per LAU2 unit in Porto 1890–2011; (b) population density variation as per LAU2 unit in Antwerp 1890–2011; (c) population density variation as per LAU2 unit in Bristol 1890–2011.
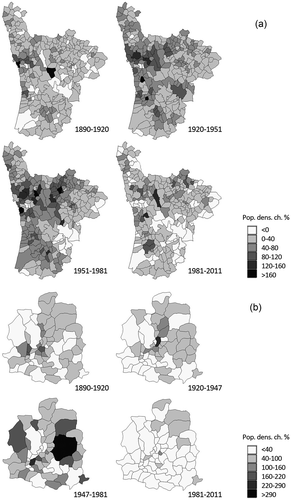
Figure 3. (Continued).
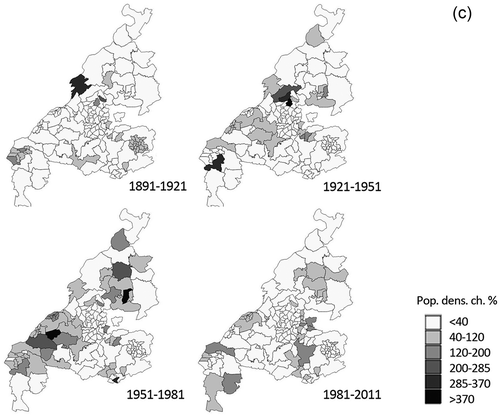
Figure 4. Population change in Porto, Antwerp and Bristol, 1890–2011 according to geographical areas (core city, remaining core MUA, other MUAs, remaining FUA).
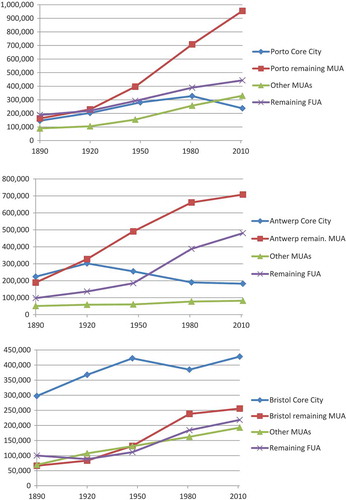
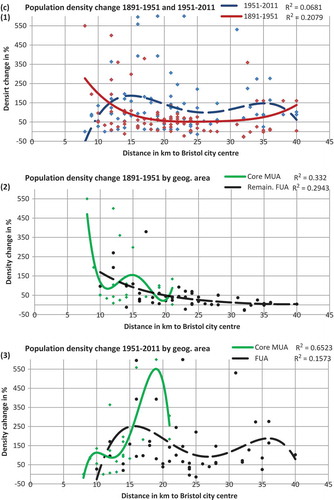
Figure 5. (a) Population density variation as a function of distance to the core city in Porto: (1) for the whole urban region, 1890–1951/1951–2011; (2, 3) by geographical area (FUA/MUAs). (b) Population density variation as a function of distance to the core city in Antwerp: (1) for the whole urban region, 1890–1951/1951–2011; (2, 3) by geographical area (FUA/MUAs). (c) Population density variation as a function of distance to the core city in Bristol: (1) for the whole urban region, 1890–1951/1951–2011; (2, 3) by geographical area (FUA/MUAs).
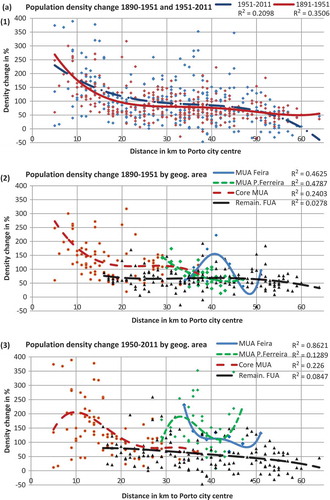
Figure 5. (Continued).
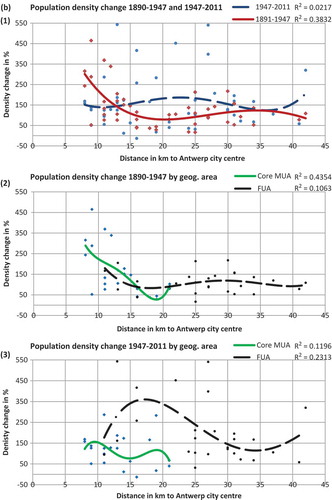
Figure 5. (Continued).