
Figures & data
Table 1. Profile of sample (n = 28).
Table 2. Mean, median and standard deviations: scores for cognitive tests and usability.
Table 3. Intercorrelation matrix for variables, age, cognitive tests and usability (Spearman’s rank order correlation).
Table 4. Cognitive tests and usability: analysis by age category (Mann Whitney).
Table 5. Usability: analysis by gender (Mann Whitney).
Table 6. Usability: analysis by education level (kruskal-wallis).
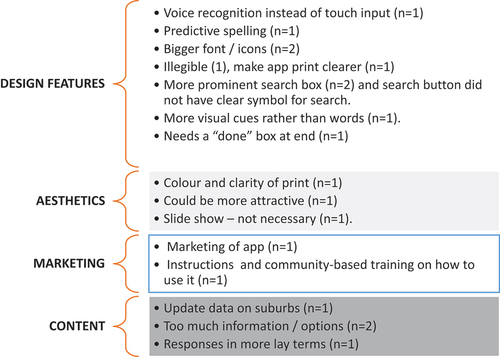
Figure 1. Recommendations for improving the app.
Data availability statement
Data will be made available from the first author.