Figures & data
Figure 1. RADARSAT-1 images of: (a) pre-event AOI-T1 16 June 1996; (b) flood event AOI-T1 24 April 1997; (c) pre-event AOI-T2 13 June 1996; and (d) flood event AOI-T2 28 April 1997.
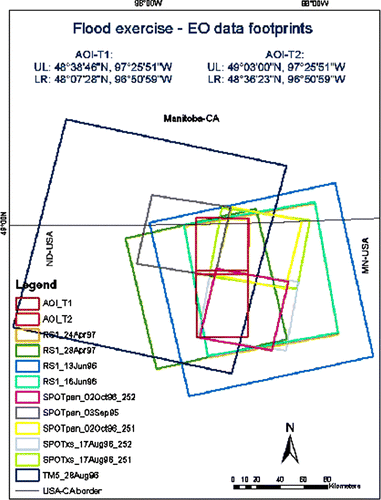
Figure 2. Footprints of the EO data sets and AOIs available for the exercise.
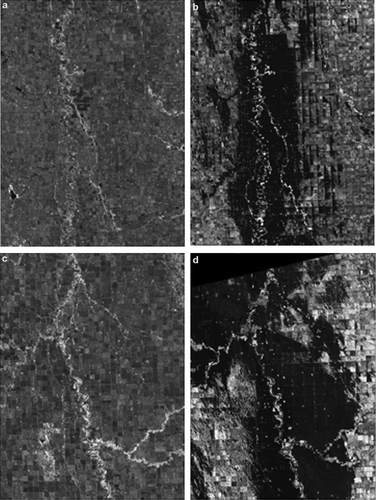
Table 1. Confusion matrix results for T1.2 product – flood mapping product for the 24 April 1997.
Table 2. Confusion matrix results for T2.2 product – flood coarse mapping for the 28 April 1997.
Figure 3. Accuracy (%) and Kappa vs. delivery time (in hours) for T1.2 product – flood coarse mapping for the 24 April 1997.
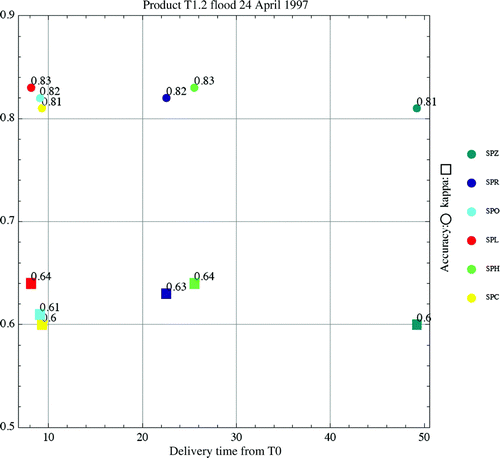
Figure 4. Accuracy (%) and Kappa vs. delivery time (in hours) for T2.2 product – flood coarse mapping for the 28 April 1997.
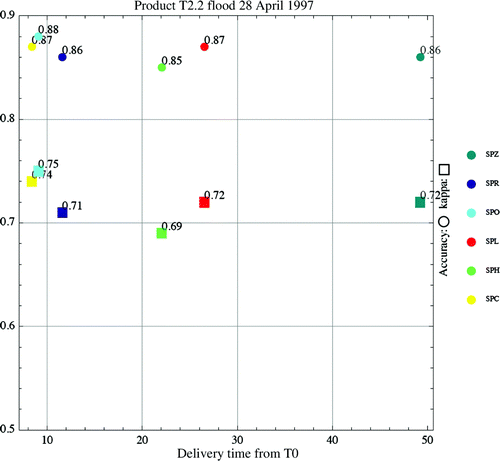
Figure 5. Missing (red) and extra (blue) areas mapping for product T1.2 – flood mapping for the 24 April 1997.
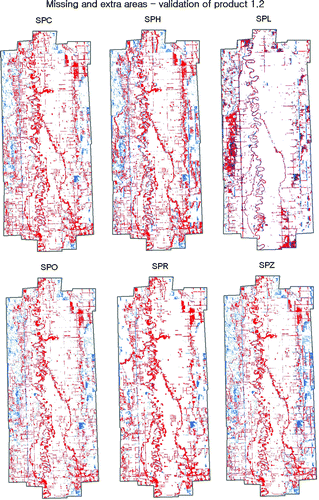
Figure 6. Missing (red) and extra (blue) areas mapping for product T2.2 – flood mapping for the 28 April 1997.
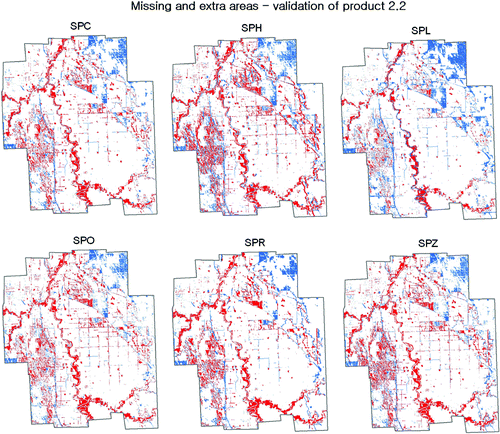
Table 3. Missing and extra areas for T1.2 product – flood mapping for the 24 April 1997.
Table 4. Missing and extra areas for T2.2 product – flood mapping for the 28 April 1997.
Figure 7. Aerial photo view of the 1997 flood.
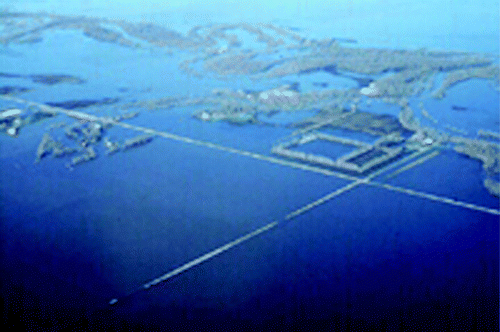
Figure 8. Mapping of missing areas due to forest presence along the Red River: (a) Radarsat-1 product of 24 April 1997; (b) aerial view; (c) mapping of the same zone as missing areas; and (d) enlarged view of the high-resolution image shows that the forest surfaces were covered by water.
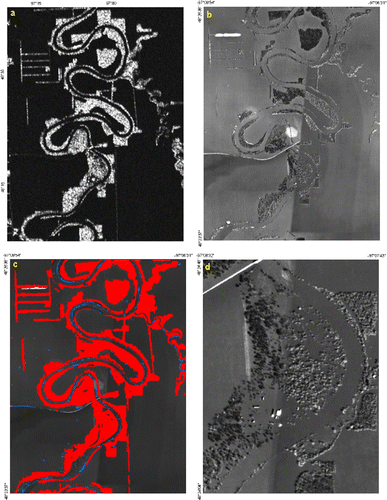
Figure 9. Correction using combined SAR and DEM: (a) SPC flood product; (b) validation product based on ground-truth data; (c) SRTM DEM (2D); (D) SRTM DEM (3D); (e) SRTM DEM classification; (f) correction of SPC flood.
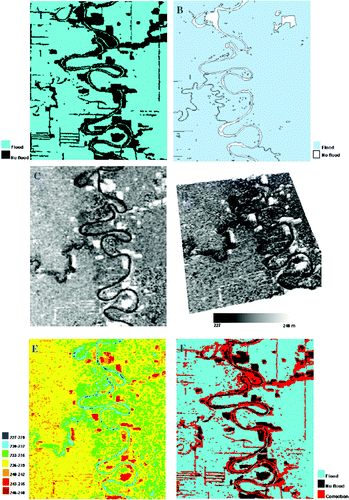
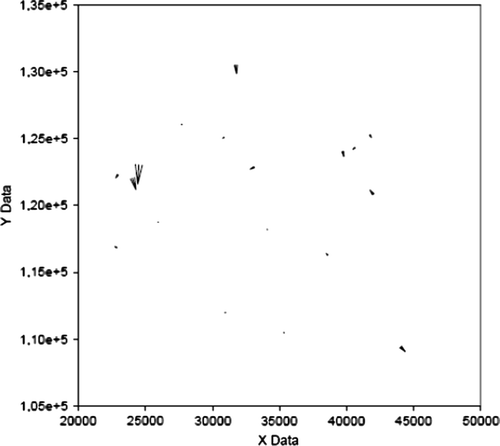
Figure 10. Rotational shift pattern observable for T1.2 of SPO (in metres); the average shift (especially in Y-direction) is larger than the expected value range of 10–15 m.