Figures & data
Figure 1. Location of the Menik Farm IDP camp in Vavuniya district, Sri Lanka.
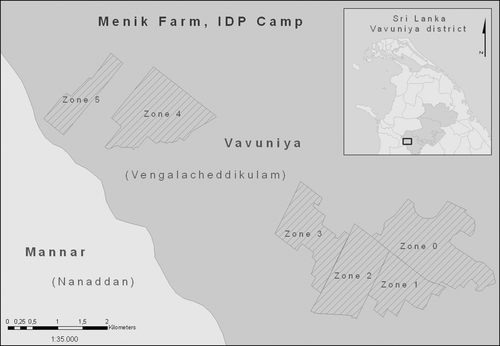
Table 1. List for very high-resolution satellites used in the analysis.
Table 2. Acquisition details for WorldView-1 and GeoEye-1 data.
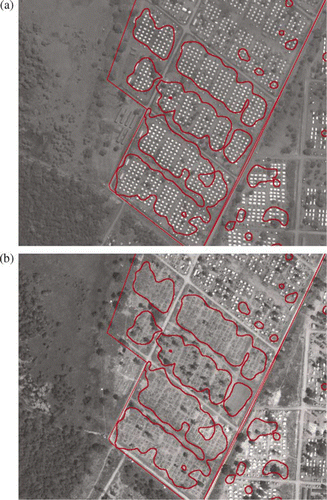
Figure 2. A sample of elongated camp structures. WorldView-1 imagery © Digitalglobe 2009, distributed by e-GEOS.
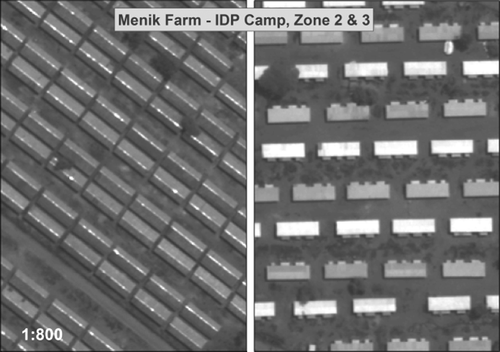
Figure 3. A sample of tents located inside Menik Farm IDP camp. WorldView-1 imagery © Digitalglobe 2009, distributed by e-GEOS.
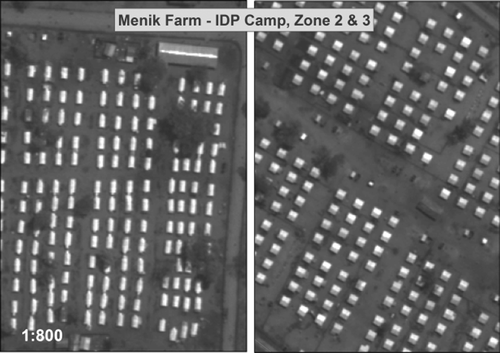
Figure 4. Presentation of the path's net constructed inside a Menik Farm IDP camp. WorldView-1 imagery © Digitalglobe 2009, distributed by e-GEOS.
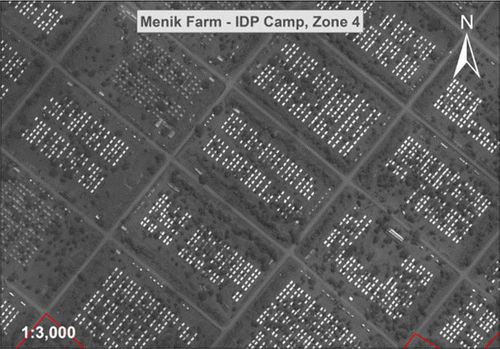
Figure 5. Presentation of the random selected samples within Menik Farm IDP Camp. WorldView-1 imagery © Digitalglobe 2009, distributed by e-GEOS.
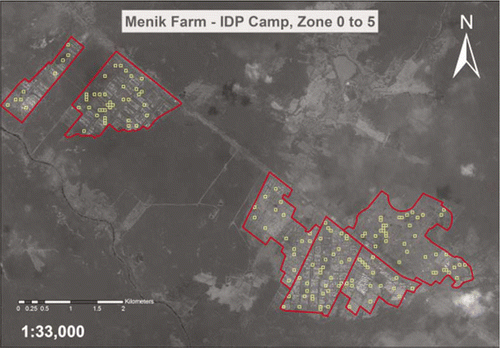
Figure 6. A randomly selected cell with tents marked as points in a visual interpretation process. WorldView-1 imagery © Digitalglobe 2009, distributed by e-GEOS.
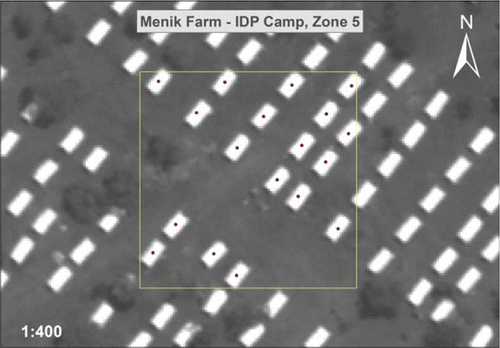
Figure 7. Randomly selected cell with tents extracted automatically and converted into the centroids.
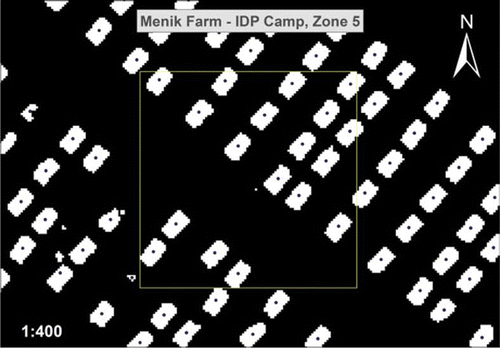
Table 3. Comparison of the number of tents derived from automatic analysis and from visual interpretation. Assessment based on satellite image acquired on 26 June 2009.
Table 4. Number of tents automatically extracted per each camp's zone. Analysis based on satellite image acquired on 26 June 2009 (WorldView-1).
Figure 8. Comparison of results from visual interpretation and automated enumeration based on 152 randomly selected cells.
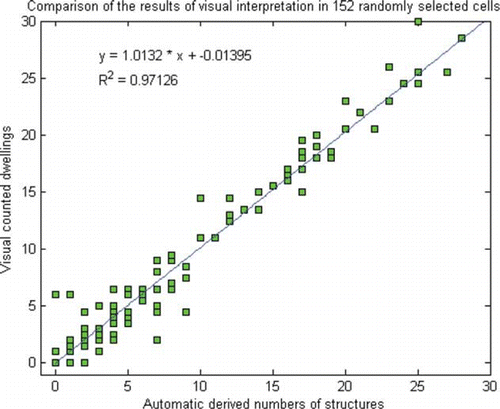
Figure 9. Menik Farm – Zone 2. Example of the structures’ appearance detected correctly: pre-image (left) and post-image (right). WorldView-1 imagery © Digitalglobe 2009 and GeoEye-1 imagery © GeoEye 2010, both distributed by e-GEOS.
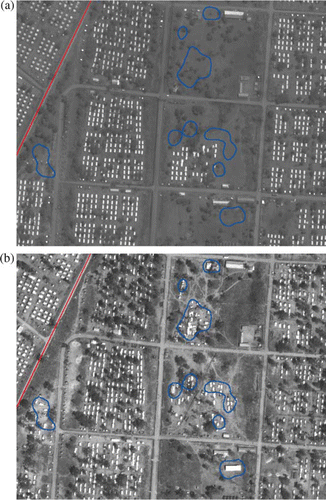
Figure 10. Menik Farm – Zone 4. Example of the structures’ appearance detected correctly: pre-image (left) and post-image (right). WorldView-1 imagery © Digitalglobe 2009 and GeoEye-1 imagery © GeoEye 2010, both distributed by e-GEOS.
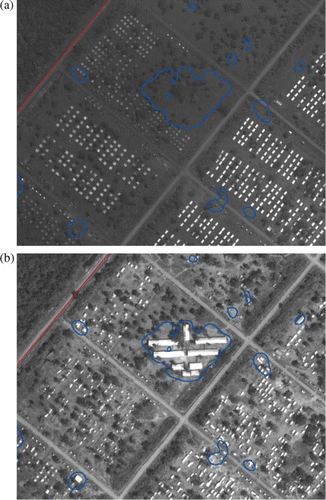
Figure 11. Menik Farm – Zone 4. Example of the disappearance of the structures detected correctly: pre-image (left) and post-image (right). WorldView-1 imagery © Digitalglobe 2009 and GeoEye-1 imagery © GeoEye 2010, both distributed by e-GEOS.
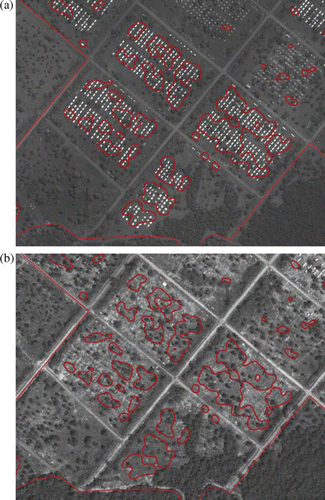
Figure 12. Menik Farm – Zone 3. Example of the disappearance of the structures detected correctly: pre-image (left) and post-image (right). WorldView-1 imagery © Digitalglobe 2009 and GeoEye-1 imagery © GeoEye 2010, both distributed by e-GEOS.