284
Views
5
CrossRef citations to date
0
Altmetric
Original Articles

Mapping urban building stocks for vulnerability assessment – preliminary results

&
Pages 117-130 | Received 15 Jun 2010, Accepted 27 Jul 2010, Published online: 02 Nov 2011

Figures & data

Figure 1.  Greek town of Pylos, as seen in the 0.6 m spatial resolution optical satellite panchromatic Quickbird image. Digital Globe ©, 2008.
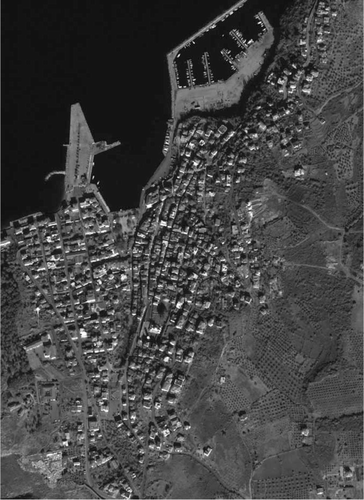
Figure 1.  Greek town of Pylos, as seen in the 0.6 m spatial resolution optical satellite panchromatic Quickbird image. Digital Globe ©, 2008.

Figure 2.  Example of a Gabor filter applied to the panchromatic image of Pylos, Greece. Wavelength: 16 m; orientation: 45°.
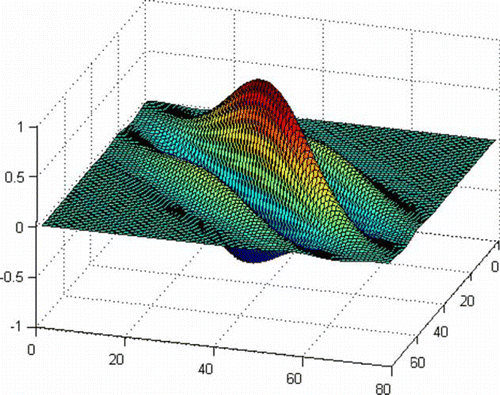
Figure 2.  Example of a Gabor filter applied to the panchromatic image of Pylos, Greece. Wavelength: 16 m; orientation: 45°.

Figure 3.  Example of SOM nodes. The size of the colour-coded circles corresponds to the number of cells that have been assigned to that node. Left: SOM with nine nodes; right: SOM with 49 nodes.
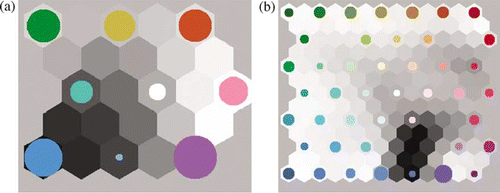
Figure 3.  Example of SOM nodes. The size of the colour-coded circles corresponds to the number of cells that have been assigned to that node. Left: SOM with nine nodes; right: SOM with 49 nodes.

Figure 4.  Segmentation results. Each cell is coloured according to the allocated cluster ID, and there is no correlation between the cells with the same colours across the different results. The numbers in the grid cells are the cluster IDs allocated to each cell.
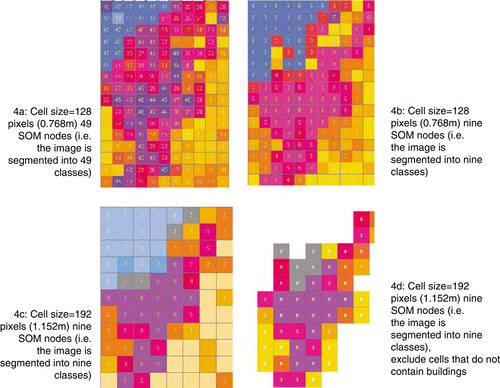
Figure 4.  Segmentation results. Each cell is coloured according to the allocated cluster ID, and there is no correlation between the cells with the same colours across the different results. The numbers in the grid cells are the cluster IDs allocated to each cell.

Figure 5.  Samples of cells that have been allocated to the same cluster.

Figure 5.  Samples of cells that have been allocated to the same cluster.

Figure 6.  Example of the structure type distribution extracted from the field data for the cells that have been assigned to the same class. From the top, in clockwise order: distribution of buildings in cluster ID 0, 6 and 3, using the results from the grid cell size of 192×192 pixels and nine SOM nodes, excluding the cells that do not contain any buildings. The numbers on the x-axis show the unique cell ID given to each cell in the image.
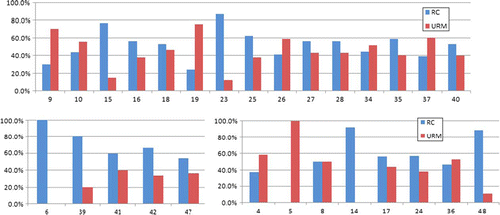
Figure 6.  Example of the structure type distribution extracted from the field data for the cells that have been assigned to the same class. From the top, in clockwise order: distribution of buildings in cluster ID 0, 6 and 3, using the results from the grid cell size of 192×192 pixels and nine SOM nodes, excluding the cells that do not contain any buildings. The numbers on the x-axis show the unique cell ID given to each cell in the image.

Figure 7.  The strong linear relationship observed between the average number of buildings in the cells assigned to the same cluster and the number of cells assigned to one cluster.
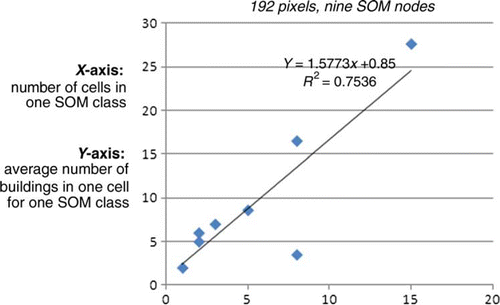
Figure 7.  The strong linear relationship observed between the average number of buildings in the cells assigned to the same cluster and the number of cells assigned to one cluster.

Table 1. The proportion of buildings assigned to each class after applying the linear relationship to the clusters according to the number of cells. Cluster ID 1 does not contain any buildings and therefore has been omitted.

Table 2. Proportion of building types estimated using the segmentation method, compared against the field data.

Reprints and Corporate Permissions

Please note: Selecting permissions does not provide access to the full text of the article, please see our help page How do I view content?

To request a reprint or corporate permissions for this article, please click on the relevant link below:

Academic Permissions

Please note: Selecting permissions does not provide access to the full text of the article, please see our help page How do I view content?

Obtain permissions instantly via Rightslink by clicking on the button below:

If you are unable to obtain permissions via Rightslink, please complete and submit this Permissions form. For more information, please visit our Permissions help page.