819
Views
7
CrossRef citations to date
0
Altmetric
Original Articles

Multi-temporal remote sensing of land cover change and urban sprawl in the coastal city of Yantai, China

, , , &
Pages 137-154 | Received 13 Sep 2011, Accepted 28 Dec 2011, Published online: 16 Mar 2012

Figures & data

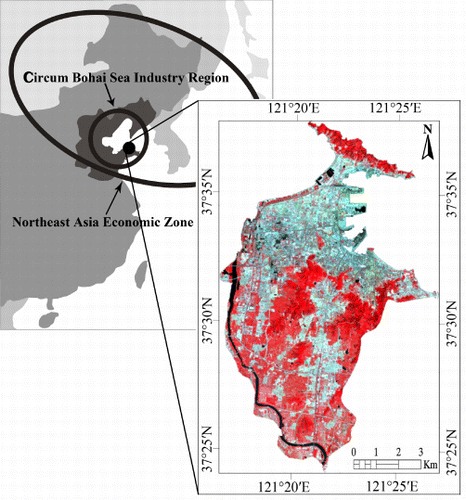
Figure 1. Location of Yantai and its color composite imagery obtained on 22 June 2009 (RGB= Landsat TM bands 4, 3, 2).

Table 1. Data types used in this study.
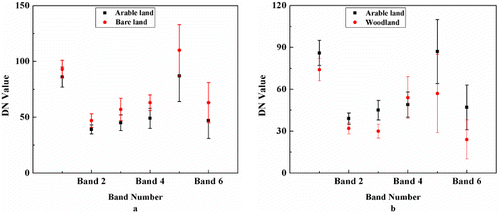
Figure 2. Digital number values' range of (a) arable land and bare land and (b) arable land and woodland on single date (25 October 2005).
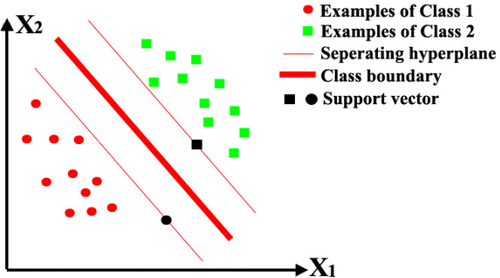
Figure 3. Linear separation of Class 1 and Class 2 in two-dimensional space with SVMc.

Table 2. Land cover classification scheme.
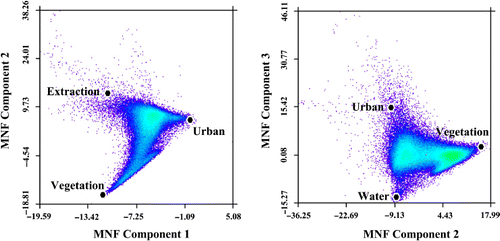
Figure 4. Feature space representation of the first three MNF components of the image acquired on 22 June 2009. Four endmembers, vegetation (e.g. agricultural land, forest and grass), extraction, urban, and water, can be identified according to these feature spaces and their associated interpretations obtained from the original reflectance data.

Table 3. Summary of classification accuracies for 1989, 1999, and 2009.

Table 4. Change detection error matrix for 1989–2009.

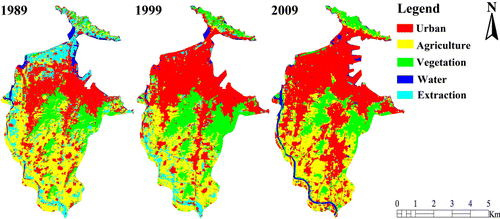
Figure 5. Land cover classification from 1989 to 2009 for Yantai.

Table 5. Summary of land cover area statistics in 1989, 1999, and 2009.

Table 6. Matrices of land cover and change statistics (km2) from 1989 to 2009.
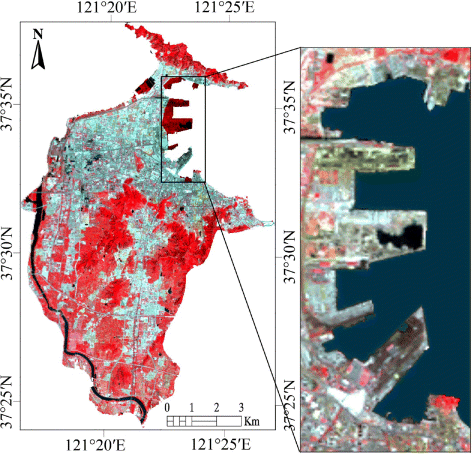
Figure 6. Newly reclaimed region for Yantai Port and related industries, shown in dark red in the left map and magnified in the right.
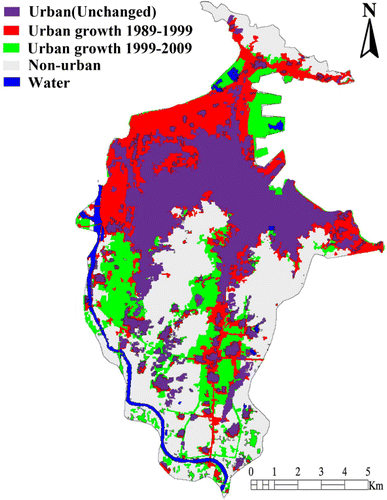
Figure 7. Urban growth from 1989 to 2009. Non-urban land cover types (agriculture, forest and extraction) that were converted to urban land from 1989 to 1999, and from 1999 to 2009 are highlighted in red and green, respectively.
Figure 8. The relationships between urban area and (a) population, (b) GIP, and (c) infrastructure investment. Yuan is the unit of Chinese currency.

Reprints and Corporate Permissions

Please note: Selecting permissions does not provide access to the full text of the article, please see our help page How do I view content?

To request a reprint or corporate permissions for this article, please click on the relevant link below:

Academic Permissions

Please note: Selecting permissions does not provide access to the full text of the article, please see our help page How do I view content?

Obtain permissions instantly via Rightslink by clicking on the button below:

If you are unable to obtain permissions via Rightslink, please complete and submit this Permissions form. For more information, please visit our Permissions help page.