848
Views
76
CrossRef citations to date
0
Altmetric
Review Papers

The HY-2 satellite and its preliminary assessment

, , , , , & show all
Pages 266-281 | Received 07 Nov 2011, Published online: 19 Mar 2012

Figures & data

Table 1. Main parameters of the HY-2 radar altimeter.

Table 2. Main parameters of the HY-2 scatterometer.

Table 3. Main parameters of the HY-2 RM.

Table 4. Main characteristics of the HY-2 satellite and its orbit.

Table 5. HY-2 dynamic model.

Table 6. HY-2 estimation parameters.

Figure 1.  Comparison of the sea surface height from the HY-2 and Jason-2 altimeters. (a) HY-2 altimeter SSH; (b) Jason-2 altimeter SSH.
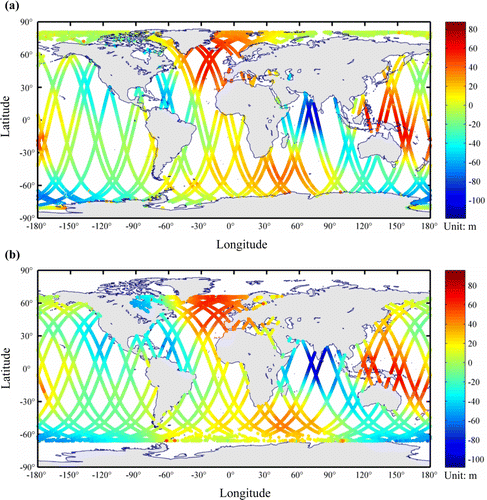
Figure 1.  Comparison of the sea surface height from the HY-2 and Jason-2 altimeters. (a) HY-2 altimeter SSH; (b) Jason-2 altimeter SSH.

Figure 2.  Comparison of the SWH from HY-2 and Jason-2 altimeters. (a) HY-2 altimeter SWH; (b) Jason-2 altimeter SWH.
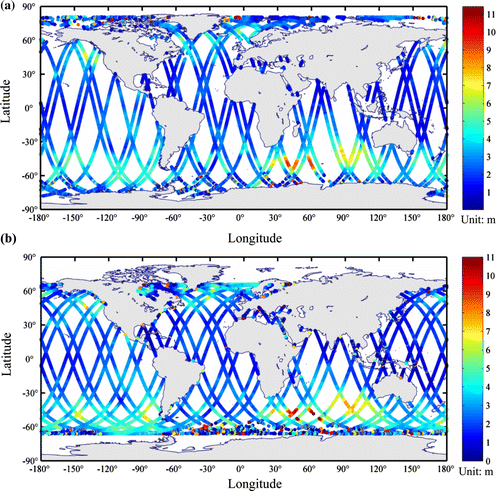
Figure 2.  Comparison of the SWH from HY-2 and Jason-2 altimeters. (a) HY-2 altimeter SWH; (b) Jason-2 altimeter SWH.

Figure 3.  Comparison of the WS from HY-2 and Jason-2 altimeters. (a) HY-2 altimeter WS; (b) Jason-2 altimeter WS.
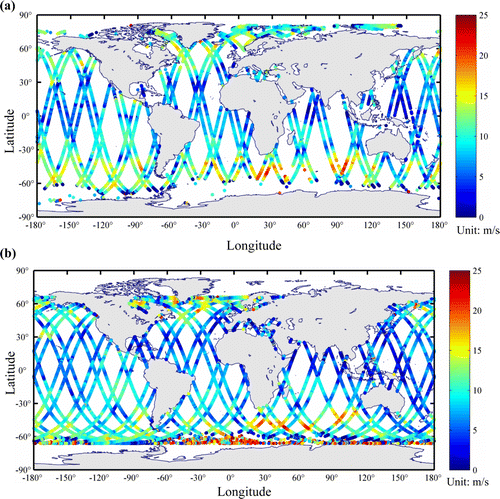
Figure 3.  Comparison of the WS from HY-2 and Jason-2 altimeters. (a) HY-2 altimeter WS; (b) Jason-2 altimeter WS.

Figure 4.  (a) σ 0 scatter plot of the inner beam for an ascending pass; (b) σ 0 scatter plot of the inner beam for a descending pass; (c) σ 0 scatter plot of the outer beam for an ascending pass; (d) σ 0 scatter plot of the outer beam for a descending pass.
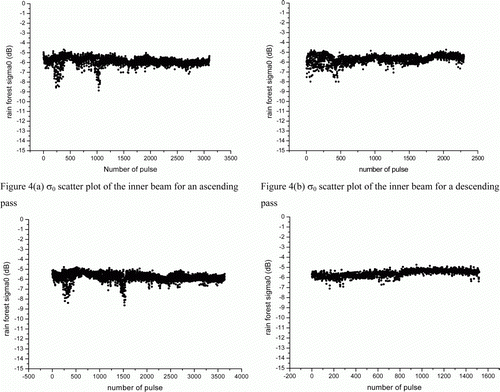
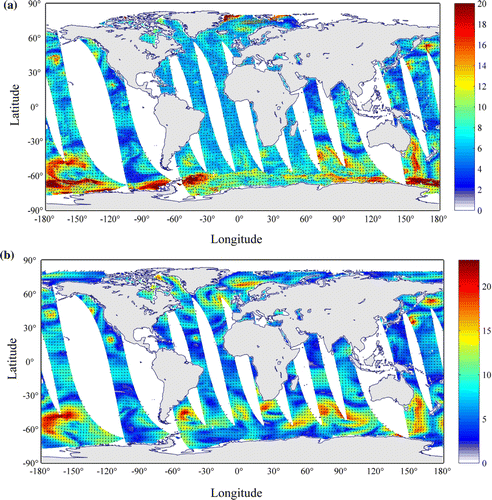
Figure 4.  (a) σ 0 scatter plot of the inner beam for an ascending pass; (b) σ 0 scatter plot of the inner beam for a descending pass; (c) σ 0 scatter plot of the outer beam for an ascending pass; (d) σ 0 scatter plot of the outer beam for a descending pass.
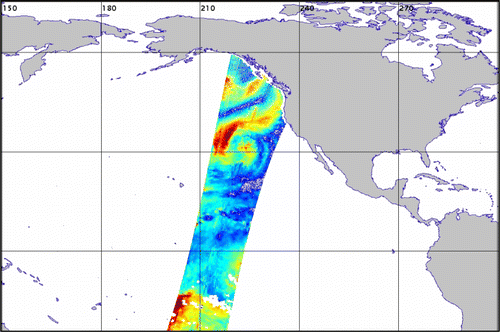
Table 7. Mean value and standard deviation of σ0 for rain forest.

Figure 5.  (a) Wind field retrieved by the HY-2 scatterometer; (b) NCEP wind field.

Figure 5.  (a) Wind field retrieved by the HY-2 scatterometer; (b) NCEP wind field.

Figure 6.  Synoptic cyclone and front structure captured by the HY-2 scatterometer.

Figure 6.  Synoptic cyclone and front structure captured by the HY-2 scatterometer.

Table 8. Comparison of HY-2 RM and NCEP re-analysis products.

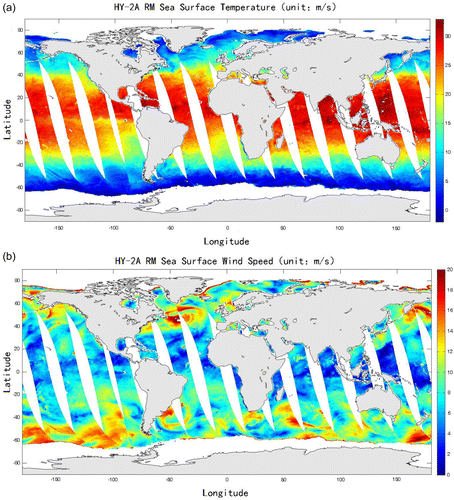
Figure 7.  (a) SST retrieved by the HY-2 RM; (b) wind speed retrieved by the HY-2 RM.

Figure 7.  (a) SST retrieved by the HY-2 RM; (b) wind speed retrieved by the HY-2 RM.

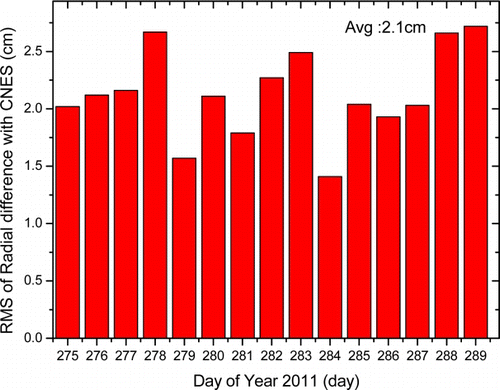
Figure 8.  RMS of radial difference with CNES.

Figure 8.  RMS of radial difference with CNES.

Reprints and Corporate Permissions

Please note: Selecting permissions does not provide access to the full text of the article, please see our help page How do I view content?

To request a reprint or corporate permissions for this article, please click on the relevant link below:

Academic Permissions

Please note: Selecting permissions does not provide access to the full text of the article, please see our help page How do I view content?

Obtain permissions instantly via Rightslink by clicking on the button below:

If you are unable to obtain permissions via Rightslink, please complete and submit this Permissions form. For more information, please visit our Permissions help page.