283
Views
1
CrossRef citations to date
0
Altmetric
Original Articles

First extensive and cost-effective quality check of Crisis Maps: presentation of assessment parameters and results

, , &
Pages 50-66 | Received 05 Oct 2011, Accepted 07 Mar 2012, Published online: 10 Apr 2012

Figures & data

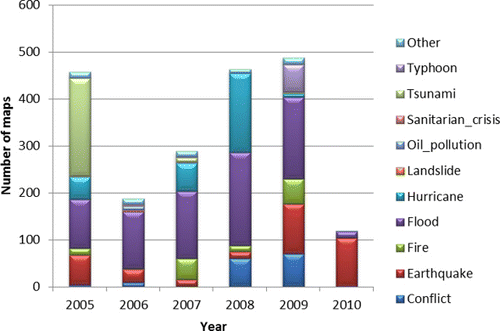
Figure 1. Population of crisis maps considered in this study (January 2005–January 2010).
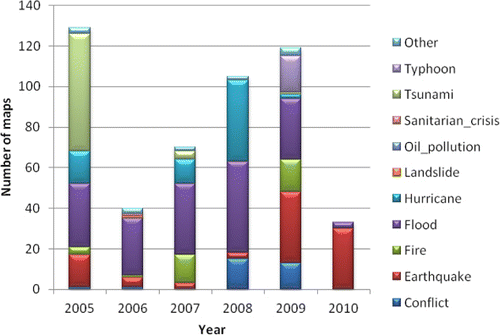
Figure 2. Sample of maps considered in the study.
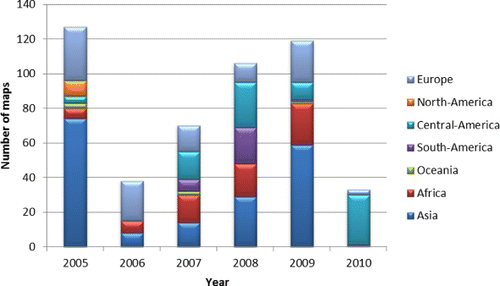
Figure 3. Distribution per continent of the sampled maps over time.

Table 1. List of 43 parameters considered for the map quality check. The parameters in bold have been considered for the global evaluation of the map quality (see Section 4.6.).

Table 2. Contingency table representing the completeness of title and the presence of the interpretation text on the map.

Table 3. Contingency table representing the quality of contrast between background and thematic entities with respect to the ease in differentiating the symbols.
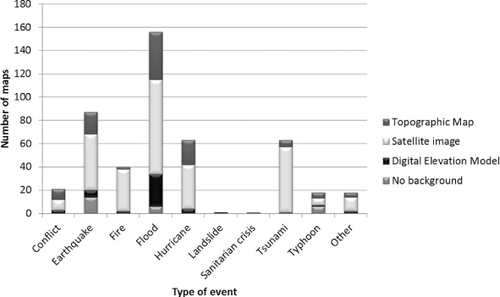
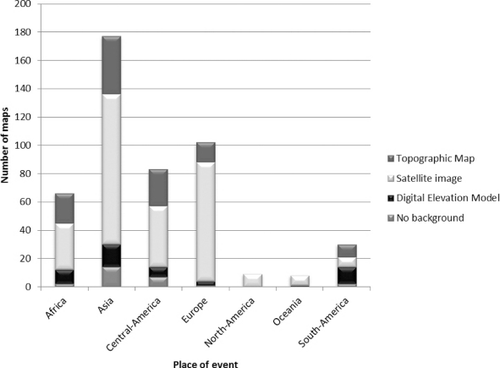
Figure 4. The use of different map backgrounds (topographic maps, satellite images or Digital Elevation Models) in the sample of maps, with respect to the type of event.
Figure 5. The use of different map backgrounds (topographic maps, satellite images or Digital Elevation Models) in the sample of maps, with respect to the place of event.
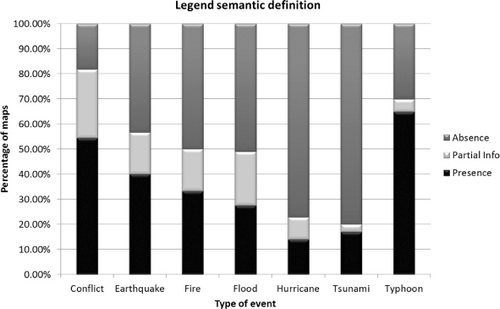
Figure 6. Presence on the sample of maps of semantic definition of the legend with respect to the type of event.
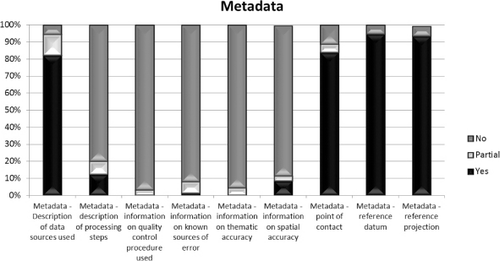
Figure 7. Presence of some information regarding the metadata.
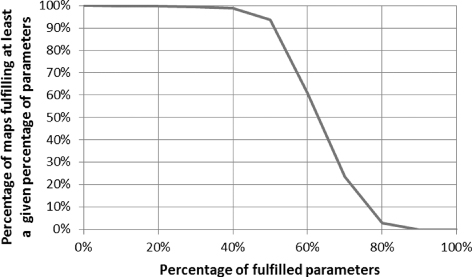
Figure 8. Percentage of maps fulfilling (at least) a given percentage of the parameters (shown in bold in ).
Figure 8. Percentage of maps fulfilling (at least) a given percentage of the parameters (shown in bold in Table 1).
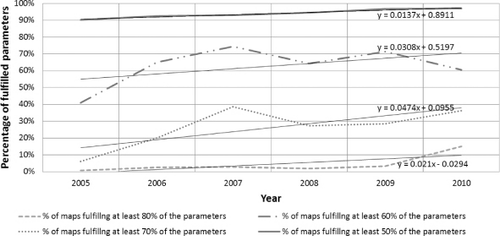
Figure 9. Trends over time of the percentages of maps fulfilling (at least) 50%, 60%, 70% and 80% of parameters (shown in bold in ).
Figure 9. Trends over time of the percentages of maps fulfilling (at least) 50%, 60%, 70% and 80% of parameters (shown in bold in Table 1).

Reprints and Corporate Permissions

Please note: Selecting permissions does not provide access to the full text of the article, please see our help page How do I view content?

To request a reprint or corporate permissions for this article, please click on the relevant link below:

Academic Permissions

Please note: Selecting permissions does not provide access to the full text of the article, please see our help page How do I view content?

Obtain permissions instantly via Rightslink by clicking on the button below:

If you are unable to obtain permissions via Rightslink, please complete and submit this Permissions form. For more information, please visit our Permissions help page.